July 31st, 2015 - Issue #796

In This Issue
1. Trading 101: How to Use the Stochastic Oscillator by EWI's Jeffrey Kennedy
2. Hot Market Report: Bearish signs for SP500?
3. Economic Calendar
1. Trading 101: How to Use the Stochastic Oscillator
A lesson from EWI's Jeffrey Kennedy
By Elliott Wave International
The stochastic oscillator is a technical tool that was popularized by George Lane. It is a momentum indicator based on the idea that in an uptrending market the close tends to be near the high of the price bar, and in a downtrending market the close tends to be near the low of the price bar.
Watch an 11-minute lesson from Jeffrey Kennedy's Trader's Classroom to learn how you can use this popular indicator in your analysis and trading.
Get more trading lessons like this one, free, from Jeffrey Kennedy:
3 Lessons: Learn to Spot Trade Setups on Your Charts
In these three video lessons, Jeffrey Kennedy shows you how to look for trading opportunities in your charts. Kennedy, instructor for Elliott Wave International's popular Trader's Classroom service, reviews the 5 core Elliott wave patterns and then shows you how to combine technical methods to create a compelling forecast.
Already have a login? Get immediate access to these lessons >>
This article was syndicated by Elliott Wave International and was originally published under the headline How to Use the Stochastic Oscillator. EWI is the world's largest market forecasting firm. Its staff of full-time analysts led by Chartered Market Technician Robert Prechter provides 24-hour-a-day market analysis to institutional and private investors around the world.
2. Hot Market Review - E-Mini S&P Sees Bearish Chart Pattern
From our friend Jim Wyckoff
Jim has an excellent daily newsletter where he reviews different markets, alerts you for potential trades and much more. Included is his great bi-weekly newsletter with charts and a little longer term outlook. We recommend checking out his website, educational CDROM, and services at www.jimwyckoff.com Click on image below to enlarge
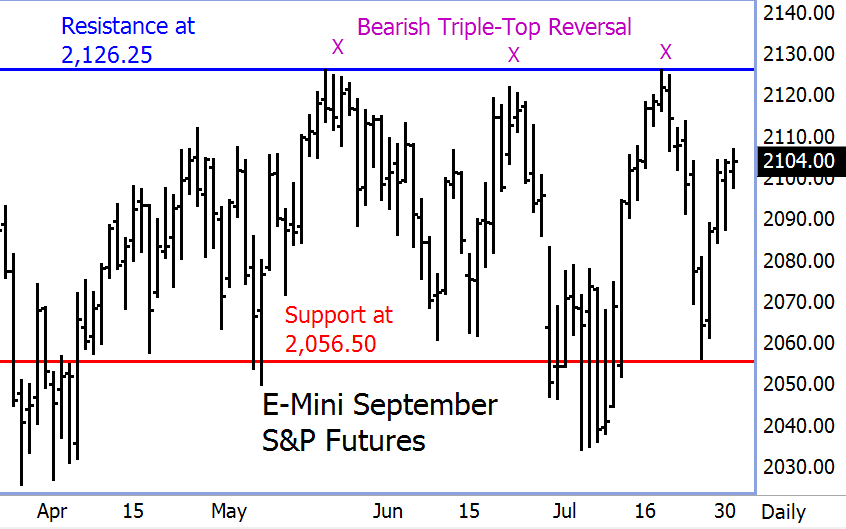 See on the daily bar chart for the September e-mini S&P futures that price action this week has seen a good rebound. However, there still exists a big and bearish triple-top reversal pattern that is a technical clue of a market top being in place. Bulls will have to take out strong overhead resistance at the contract high of 2,126.25 to gain fresh power, to then suggest a new and large leg up in prices in the coming weeks. But if recent history plays out again, that stiff overhead resistance will again check the rally... Stay tuned!
3. Economic Calendar
Source: Moore Research Center, Inc.
| Date | Reports | Expiration & Notice Dates |
| 08/03 Mon |
7:30 AM CDT - PCE Prices-Core(Jun) 7:30 AM CDT - Personal Income & Spending(Jun) 9:00 AM CDT - Construction Spending(Jun) 9:00 AM CDT - ISM Index(Jul) 4:00 PM CDT - Auto & Truck Sales(Jul) |
|
| 08/04 Tues |
9:00 AM CDT - Factory Orders(Jun) |
FN: Aug RBOB & ULSD(NYM) |
| 08/05 Wed |
6:00 AM CDT - MBA Mortgage Purchase Index 7:15 AM CDT - ADP Employment Change(Jul) 7:30 AM CDT - Trade Balance(Jun) 9:00 AM CDT - ISM Services(Jul) 9:30 AM CDT - API & DOE Energy Stats 2:00 PM CDT - Dairy Products Sales |
|
| 08/06 Thurs |
6:30 AM CDT - Challenger Job Cuts(Jul) 7:30 AM CDT - USDA Weekly Export Sales 7:30 AM CDT - Initial Claims-Weekly 9:30 AM CDT - EIA Gas Storage 3:30 PM CDT - Money Supply |
FN: Aug Crude Lt(NYM) |
| 08/07 Fri |
7:30 AM CDT - Ave Workweek & Hourly Earnings(Jul) 7:30 AM CDT - Nonfarm Payrolls(Jul) 7:30 AM CDT - Unemployment Rate(Jul) 2:00 PM CDT - Consumer Credit(Jun) |
LT: Aug Canadian Dollar Options(CME) Aug Currencies Options(CME) Aug Live Cattle Options(CME) Aug US Dollar Index Options(ICE) Sep Cocoa Options(ICE) |
| 07/27 Mon |
FN: Aug Live Cattle(CME) LT: Sep Sugar-16(ICE) |
* Please note that the information contained in this letter is intended for clients, prospective clients, and audiences who have a basic understanding, familiarity, and interest in the futures markets.
** The material contained in this letter is of opinion only and does not guarantee any profits. These are risky markets and only risk capital should be used. Past performances are not necessarily indicative of future results.
*** This is not a solicitation of any order to buy or sell, but a current market view provided by Cannon Trading Inc. Any statement of facts herein contained are derived from sources believed to be reliable, but are not guaranteed as to accuracy, nor they purport to be complete. No responsibility is assumed with respect to any such statement or with respect to any expression of opinion herein contained. Readers are urged to exercise their own judgment in trading!