Weekly Newsletters, Futures Trading Tips & Insight, Commodity Trading Educational Resources & Much More.

by Mark O’Brien, Senior Broker
General:
It’s been ten months since the central bank paused its rate hike cycle. It seems as though Jay Powell’s motto throughout his entire tenure as chairman of the Fed has been, “The data will guide our decisions,” and today the Bureau of Labor Statistics released another chunk of data: its March Consumer Price Index (CPI) report, which measures the prices paid by consumers for a basket of consumer goods and services. The consumer-price index rose 0.4% in March and 3.5% on an annual basis. Economists had expected 0.3% and 3.4%. Core CPI, which removes the volatile food and energy categories, was up 0.4% from February, topping an expected 0.3%. Now, after strong prints in January and February, are these new readings stronger evidence of a “sticky” inflation situation?
At their March meeting, according to its minutes released later this morning, Federal Reserve officials expressed concern that inflation wasn’t moving lower quickly enough. The CPI report likely didn’t moderate those concerns and the timing for the first long-anticipated rate cut has presumably drifted further out on the calendar.
Energies:
Speaking of inflation, the first three months of 2024 saw crude oil jump ±$17 per barrel – a ±$17,000 move for the main 1,000-barrel futures contract – with the front-month May contract trading to the year’s high of $87.63 intraday just last Friday.
Softs:
After a one-day 321-point/$3,210 move up on March 12 to close above $7,000/ton – its latest all-time high – May cocoa continued its “no top in sight,” rally, closing today at $10,476/ton, a staggering ±$34,700 per contract move in twenty trading sessions.
Metals:
While cocoa retained its “king of the all-time highs” crown for the month, gold did not disappoint bulls in this market, setting its own new all-time high yesterday, trading up to $2,384.50/oz. intraday (basis the June futures contract). This is a $199.00/oz. move ($19,900 per contract for the standard 100-oz. futures contract) over the same 20-sesson span as the move in cocoa referenced above.
Grains:
Keep an eye out for tomorrow’s U.S. Department of Agriculture’s two main reports: its monthly Crop Production and World Agricultural Supply and Demand Estimates (WASDE). These serve as the primary informers of the fundamentals underlying domestic and global agricultural futures markets.


Get access to proprietary indicators and trading methods, consult with an experienced broker at 1-800-454-9572.
Explore trading methods. Register Here

* This is not a solicitation of any order to buy or sell, but a current market view provided by Cannon Trading Inc. Any statement of facts here in contained are derived from sources believed to be reliable, but are not guaranteed as to accuracy, nor they purport to be complete. No responsibility is assumed with respect to any such statement or with respect to any expression of opinion herein contained. Readers are urged to exercise their own judgement in trading.

Important Notices –


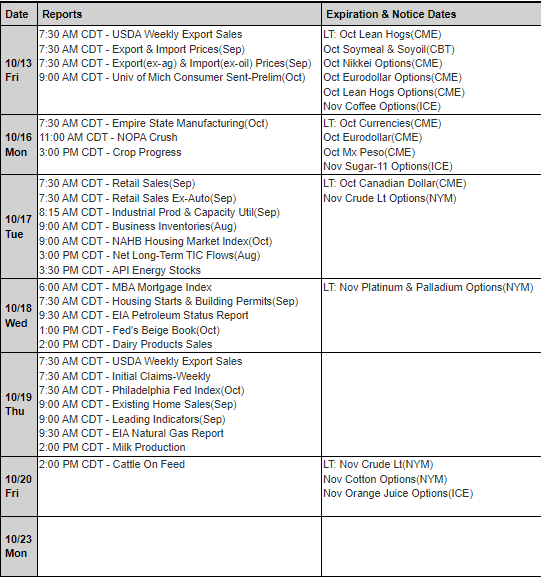
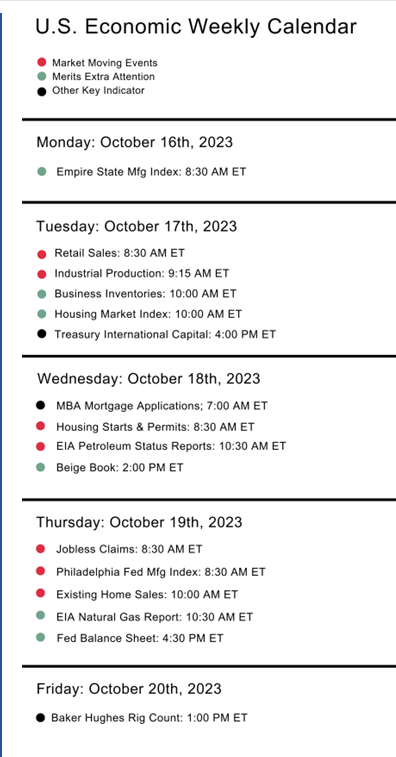
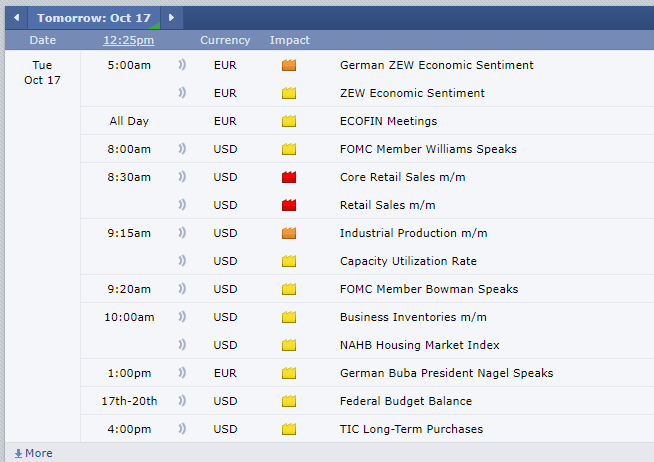
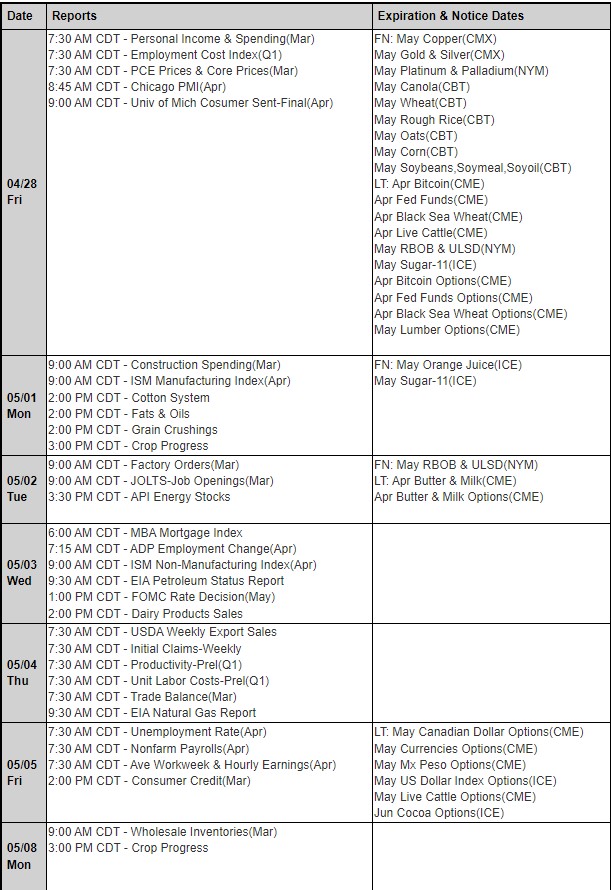
Trading Reports for Next Week


Get access to proprietary indicators and trading methods, consult with an experienced broker at 1-800-454-9572.
Explore trading methods. Register Here
* This is not a solicitation of any order to buy or sell, but a current market view provided by Cannon Trading Inc. Any statement of facts here in contained are derived from sources believed to be reliable, but are not guaranteed as to accuracy, nor they purport to be complete. No responsibility is assumed with respect to any such statement or with respect to any expression of opinion herein contained. Readers are urged to exercise their own judgement in trading.

Important Notices –


Trading Reports for Next Week

Get access to proprietary indicators and trading methods, consult with an experienced broker at 1-800-454-9572.
Explore trading methods. Register Here

* This is not a solicitation of any order to buy or sell, but a current market view provided by Cannon Trading Inc. Any statement of facts here in contained are derived from sources believed to be reliable, but are not guaranteed as to accuracy, nor they purport to be complete. No responsibility is assumed with respect to any such statement or with respect to any expression of opinion herein contained. Readers are urged to exercise their own judgement in trading.

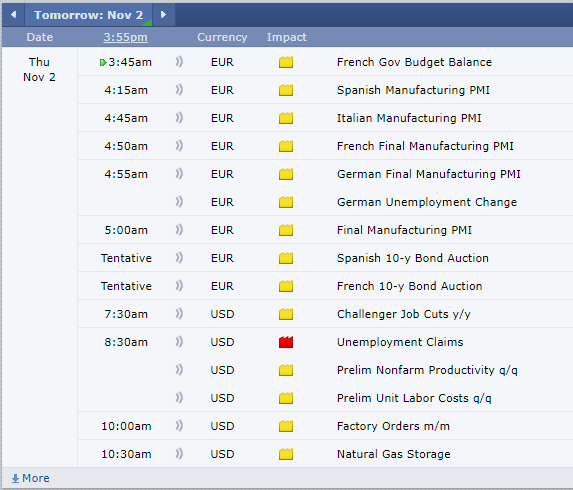
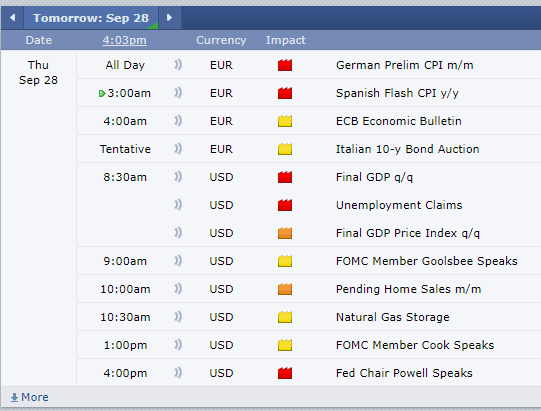
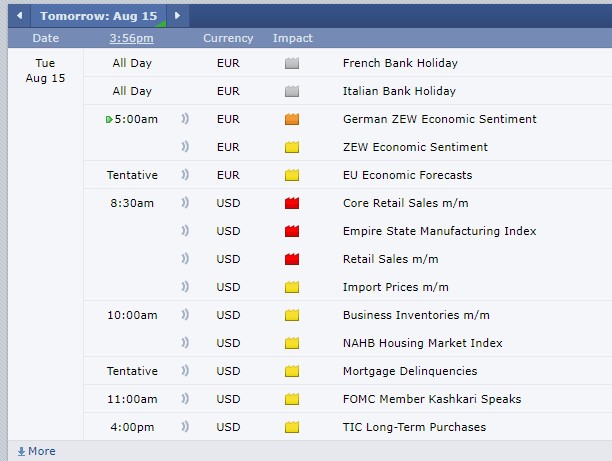
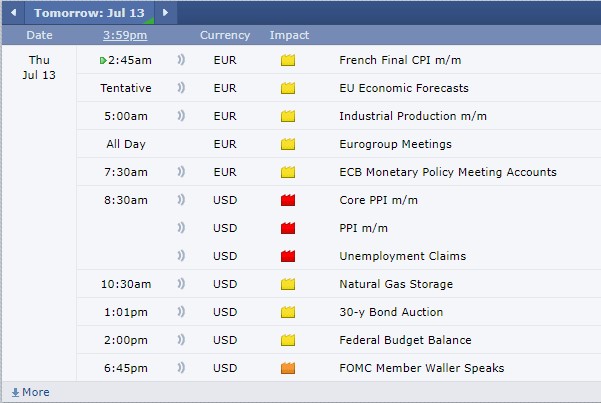
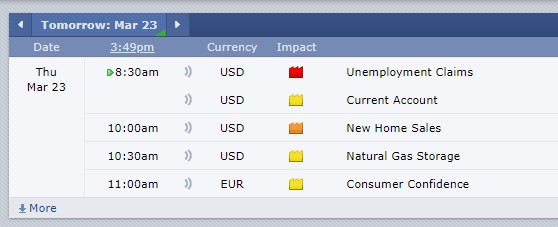
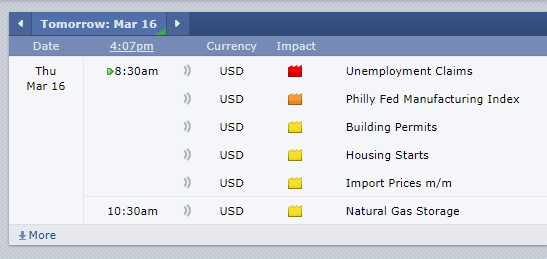
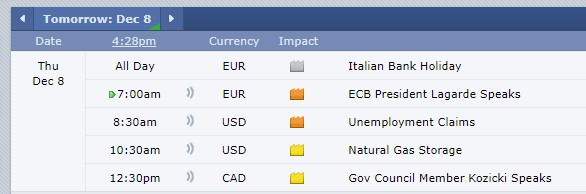
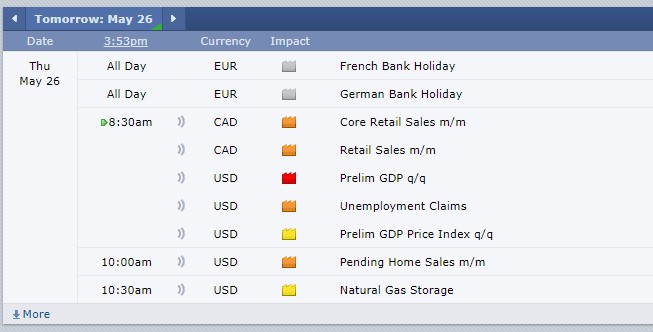
We have a FULL day tomorrow with several reports, FED members talking and more….
Natural Gas bounced sharply on news that Chesapeake cuts production outlook
Cocoa continues it’s run into unknown territories….up over 4% today!
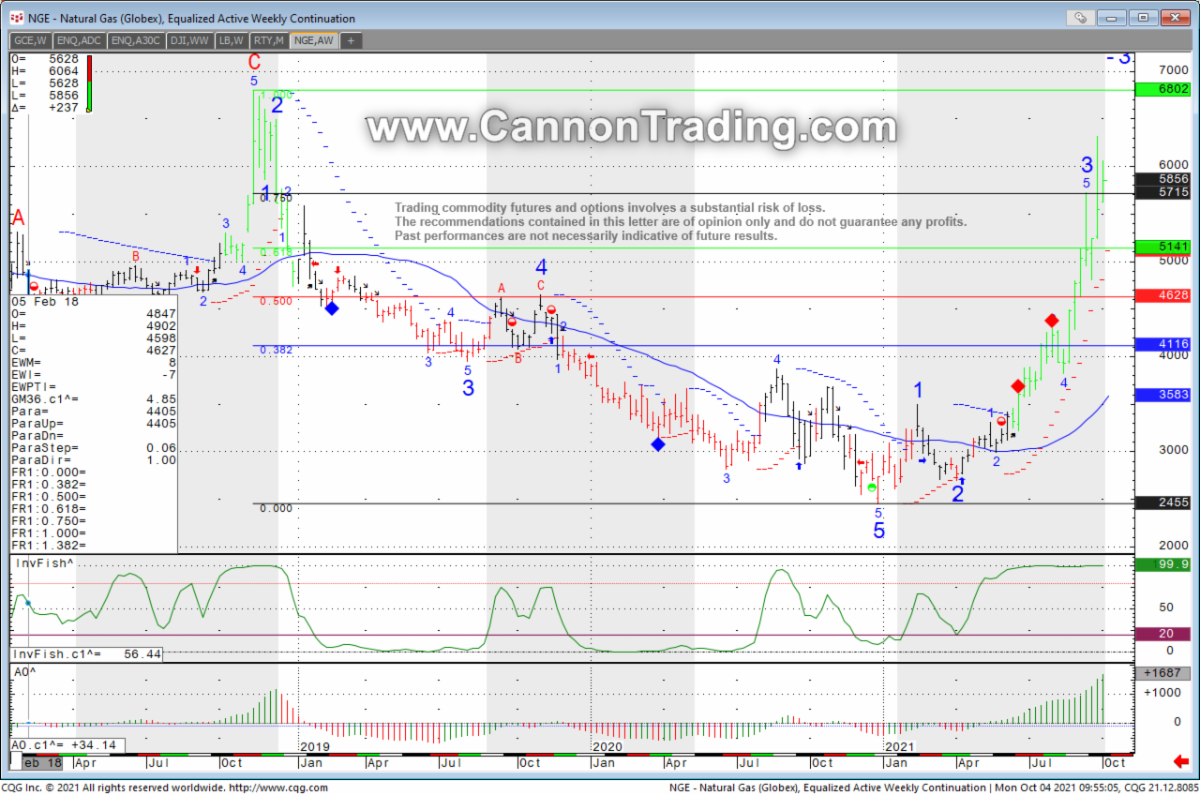
Natural Gas Daily Chart for review below:


Get access to proprietary indicators and trading methods, consult with an experienced broker at 1-800-454-9572.
Explore trading methods. Register Here
* This is not a solicitation of any order to buy or sell, but a current market view provided by Cannon Trading Inc. Any statement of facts here in contained are derived from sources believed to be reliable, but are not guaranteed as to accuracy, nor they purport to be complete. No responsibility is assumed with respect to any such statement or with respect to any expression of opinion herein contained. Readers are urged to exercise their own judgement in trading.
Join our Private Facebook group
Subscribe to our YouTube Channel
By Mark O’Brien, Senior Broker
A six-month decline followed by a two-month rally of almost equal price movement. On April 4, Feb gold traded to its all time high of $2,140.30 per ounce. Almost six months to the day, on Oct. 6, the benchmark precious metal had declined ±$300 per ounce (a ±$30,000 move) to $1,842.50. Then, within almost an exact two-month span, on the Sunday Dec. 4th opening of trading, Feb. gold capped a ±$300 per ounce rally, trading briefly up to a new all-time high of $2,152.50. Today, gold prices fell to a more than one-month low, trading intra-day to $2,004.60 per ounce. Credit strong economic data that strengthened dollar and Treasury yields and lowered market expectations of a U.S. rate cut in March. The Commerce Department reported a more-than-expected rise in U.S. retail sales for December. This followed the strong gains in employment and wage gains reported earlier this month and an uptick in inflation last week.
The U.S. Consumer Price Index last week did not persuasively indicate under-control inflation,
but with energy and grain prices remaining significantly below last year’s highs, the prevailing
direction of inflation points down with economic conditions improving.
Heads up: Both Natural Gas and Crude Oil numbers come out tomorrow due to MLK holiday this past Monday and the short trading week.
Trading Futures, Options on Futures, and retail off-exchange foreign currency transactions involves substantial risk of loss and is not suitable for all investors. You should carefully consider whether trading is suitable for you in light of your circumstances, knowledge, and financial resources. You may lose all or more of your initial investment. Opinions, market data, and recommendations are subject to change at any time when it comes to Futures Trading.
01-18-2024

#ES, #NQ, #YM, #RTY, #XBT, #GC, #SI, #CL, #ZB, #6E, #ZC, #ZW, #ZS, #ZM, #NG


This is not a solicitation of any order to buy or sell, but a current market view provided by Cannon Trading Inc. Any statement of facts here in contained are derived from sources believed to be reliable, but are not guaranteed as to accuracy, nor they purport to be complete. No responsibility is assumed with respect to any such statement or with respect to any expression of opinion herein contained. Readers are urged to exercise their own judgement in trading.
Join our Private Facebook group
Subscribe to our YouTube Channel
March is front month for stock indices and currency futures.
Symbol for March is H, so example ESH24
February is front month for crude oil.
Video: Projecting possible targets when trading futures


Trading Futures, Options on Futures, and retail off-exchange foreign currency transactions involves substantial risk of loss and is not suitable for all investors. You should carefully consider whether trading is suitable for you in light of your circumstances, knowledge, and financial resources. You may lose all or more of your initial investment. Opinions, market data, and recommendations are subject to change at any time when it comes to Futures Trading.
12-20-2023

#ES, #NQ, #YM, #RTY, #XBT, #GC, #SI, #CL, #ZB, #6E, #ZC, #ZW, #ZS, #ZM, #NG

This is not a solicitation of any order to buy or sell, but a current market view provided by Cannon Trading Inc. Any statement of facts here in contained are derived from sources believed to be reliable, but are not guaranteed as to accuracy, nor they purport to be complete. No responsibility is assumed with respect to any such statement or with respect to any expression of opinion herein contained. Readers are urged to exercise their own judgement in trading.
Join our Private Facebook group
Subscribe to our YouTube Channel
By Mark O’Brien, Senior Broker
General:
It seems like no futures markets are more focused on trading off expectations than those of interest rate futures, like the 10-year T-note and 30-year T-bond. And those expectations are more focused on one source of information more than any other: the words and actions of the U.S. Federal Reserve Bank’s governors and current chairman, Jerome Powell. The Fed. board’s governors’ words are incessantly parsed for any clues as to the future direction of interest rate policy. Each coming Federal Open Market Committee meeting becomes the latest most important meeting in memory and next week’s is no exception. The U.S. economy is slowing; there are signs inflation is falling and the Fed has kept interest rates steady – at a range of 5.25% to 5.50%, the highest since 2001 – through its last two meetings after raising rates at the conclusion of eleven consecutive meetings before that. If “three is a trend,” and if the Fed. holds interest rates steady (widely forecast) look for the futures markets to pile on to the already-shifting expectation that a rate cut is coming sooner than later. As is customary, Chair Powell will likely try to communicate that the Central Bank’s job of controlling inflation is ongoing and any decision on the future of interest rates – up, down, or steady – will be based on broad definitive proof of the need to act, or not. Next week’s meeting is a 2-day affair, with the announcement scheduled for Wednesday at 1:00 P.M. Central Time, followed by Chair Powell’s press conference. Stay tuned.
Energy:
Already entering today’s trading on a 4-day losing streak, crude oil futures extended its sell-off which as of this typing broke through $70.00 per barrel to an intra-day low of $69.11, its lowest price since July 3 (basis the January contract).
While today’s weekly Energy Information Administration report showed crude inventories fell by 4.6 million barrels, far exceeding the 1.4 million-barrel drop analysts had expected, U.S. gasoline stocks rose by 5.4 million barrels last week, more than five times the 1 million-barrel rise analysts expected.
News concerning “the elephant in the room” – China’s economic health – also pressed down on prices. Yesterday, rating agency Moody’s lowered the outlook on China’s A1 rating from stable to negative.
Getting help from the currency market, the U.S. dollar stayed on its upward rebound from 3+ month lows of last week to a two-week high. For all things dollar denominated – particularly globally traded commodities – a rising dollar pressures demand by making purchases more expensive for holders of other currencies.
Plan your trade and trade your plan.

Trading Futures, Options on Futures, and retail off-exchange foreign currency transactions involves substantial risk of loss and is not suitable for all investors. You should carefully consider whether trading is suitable for you in light of your circumstances, knowledge, and financial resources. You may lose all or more of your initial investment. Opinions, market data, and recommendations are subject to change at any time when it comes to Futures Trading.
12-07-2023

#ES, #NQ, #YM, #RTY, #XBT, #GC, #SI, #CL, #ZB, #6E, #ZC, #ZW, #ZS, #ZM, #NG

This is not a solicitation of any order to buy or sell, but a current market view provided by Cannon Trading Inc. Any statement of facts here in contained are derived from sources believed to be reliable, but are not guaranteed as to accuracy, nor they purport to be complete. No responsibility is assumed with respect to any such statement or with respect to any expression of opinion herein contained. Readers are urged to exercise their own judgement in trading.
By Senior Broker, Mark O’Brien
General:
Prior to this blog’s release, the Federal Reserve Bank’s Open Market Committee held rates steady at 5.25% – 5.50% for the second consecutive meeting, yet another indication that the global central bank rate hike cycle is coming to an end. At the same time, Fed. chair Powell stayed on message by suggesting more rate hikes could be in the pipeline should inflation remain “sticky.”
Keep in mind that a favorite inflation gauge of the Fed is the quarterly Core Personal Consumption Expenditures Index (Core PCE), which last Friday recorded its eighth monthly decline in a row – down to a 3.68% YOY increase and the lowest reading since May 2021.
Energy:
If there was a fear / anticipation that the crisis in the Middle East would lead to extended physical supply disruptions for the energy markets, that fear – and crude oil prices – has abated in the last week or so. After its initial ±$2.00 per barrel gap-up opening to ±$83.25 per barrel the Sunday after the outbreak of hostilities, Dec. crude oil spent two weeks reaching up to $89.85 intraday on Friday the 20th. As of this typing, it’s trading over $9.00 per barrel lower near $80.00 per barrel, below pre-hostility prices. Certainly without notice, the war could escalate. Expansion militarily between the current parties involved, or in concert with expanded state or non-state participation including the United States, Iran, Syria, Hezbollah could inject a “war premium” into energy prices and extend to other commodities.
Risk:
The point here is not to opine that this is the direction the conflict will go. There are a range of possible scenarios for the Israel-Gaza conflict, from an expansion to a broader regional war to a negotiated cessation of hostilities. There are parties and catalysts capable of steering the situation in either direction.
The idea is to caution traders of the potential for increased volatility and to suggest you approach your futures trading generally with risk-defined strategies, such as hard stop orders, option protection, hedge positions & futures and options spread applications.
Plan your trade and trade your plan.

Trading Futures, Options on Futures, and retail off-exchange foreign currency transactions involves substantial risk of loss and is not suitable for all investors. You should carefully consider whether trading is suitable for you in light of your circumstances, knowledge, and financial resources. You may lose all or more of your initial investment. Opinions, market data, and recommendations are subject to change at any time when it comes to Futures Trading.
11-02-2023

#ES, #NQ, #YM, #RTY, #XBT, #GC, #SI, #CL, #ZB, #6E, #ZC, #ZW, #ZS, #ZM, #NG
This is not a solicitation of any order to buy or sell, but a current market view provided by Cannon Trading Inc. Any statement of facts here in contained are derived from sources believed to be reliable, but are not guaranteed as to accuracy, nor they purport to be complete. No responsibility is assumed with respect to any such statement or with respect to any expression of opinion herein contained. Readers are urged to exercise their own judgement in trading.
Join our private Facebook group for additional insight into trading and the futures markets!
Competition Details

#ES, #NQ, #YM, #RTY, #XBT, #GC, #SI, #CL, #ZB, #6E, #ZC, #ZW, #ZS, #ZM, #NG

This is not a solicitation of any order to buy or sell, but a current market view provided by Cannon Trading Inc. Any statement of facts herein contained are derived from sources believed to be reliable but are not guaranteed as to accuracy, nor they purport to be complete. No responsibility is assumed with respect to any such statement or with respect to any expression of opinion herein contained. Readers are urged to exercise their own judgment in trading.
Learn more about trading Crude Oil Futures with E-Futures.com here.
Trading oil futures, particularly crude oil futures, plays a pivotal role in the global energy market and is influenced by a multitude of factors. This article explores the dynamics of trading oil futures in the United States and delves into the impact of Middle East conflicts, with a specific focus on recent events in Israel and Gaza. These geopolitical tensions have far-reaching implications for oil futures, as the Middle East remains a crucial source of crude oil production.
Crude Oil Futures in the USA
Crude oil is a fundamental component of the global economy, and the United States, as one of the largest consumers and producers of oil, is deeply entrenched in the world of oil futures trading. Crude oil futures are standardized contracts that allow traders to buy or sell a specified amount of crude oil at a predetermined price on a future date. In the USA, these futures are primarily traded on the New York Mercantile Exchange (NYMEX) under the ticker symbol CL.
The demand for crude oil futures in the USA is driven by various factors, including:
Middle East Conflicts and Oil Futures
The Middle East is known for its volatile geopolitical environment, often stemming from religious, territorial, and political disputes. Recent events in Israel and Gaza have further highlighted the role of geopolitical tensions in influencing oil futures prices.
Impact of Recent Israel-Gaza Conflict
The Israel-Gaza conflict, a long-standing and deeply rooted conflict in the Middle East, has repeatedly led to fluctuations in oil prices and, consequently, crude oil futures. Recent escalations in the region have had the following effects:
Risk Management in Oil Futures Trading
Given the inherent volatility in oil markets, traders in crude oil futures must employ effective risk management strategies. These include:
Trading crude oil futures in the USA is a complex and dynamic process that is deeply interconnected with global geopolitics. Recent events in the Middle East, especially the Israel-Gaza conflict, highlight the significant influence of geopolitical tensions on oil futures prices. Traders and investors must remain vigilant, stay informed, and employ effective risk management strategies to navigate the ever-changing landscape of crude oil futures trading. As the world continues to rely on oil as a primary energy source, the impact of geopolitical conflicts on oil futures remains a critical consideration in the financial markets.
Ready to start trading futures? Call
1(800)454-9572 and speak to one of our experienced, Series-3 licensed futures brokers and start your futures trading journey at E-Futures.com today.
Plan your trade and trade your plan.
Trading Futures, Options on Futures, and retail off-exchange foreign currency transactions involves substantial risk of loss and is not suitable for all investors. You should carefully consider whether trading is suitable for you in light of your circumstances, knowledge, and financial resources. You may lose all or more of your initial investment. Opinions, market data, and recommendations are subject to change at any time when it comes to Futures Trading.
10-17-2023

#ES, #NQ, #YM, #RTY, #XBT, #GC, #SI, #CL, #ZB, #6E, #ZC, #ZW, #ZS, #ZM, #NG
Download your FREE copy of Order Flow Essentials!

This is not a solicitation of any order to buy or sell, but a current market view provided by Cannon Trading Inc. Any statement of facts here in contained are derived from sources believed to be reliable, but are not guaranteed as to accuracy, nor they purport to be complete. No responsibility is assumed with respect to any such statement or with respect to any expression of opinion herein contained. Readers are urged to exercise their own judgement in trading.
Join our private Facebook group for additional insight into trading and the futures markets!
Competition Details
#ES, #NQ, #YM, #RTY, #XBT, #GC, #SI, #CL, #ZB, #6E, #ZC, #ZW, #ZS, #ZM, #NG
This is not a solicitation of any order to buy or sell, but a current market view provided by Cannon Trading Inc. Any statement of facts herein contained are derived from sources believed to be reliable but are not guaranteed as to accuracy, nor they purport to be complete. No responsibility is assumed with respect to any such statement or with respect to any expression of opinion herein contained. Readers are urged to exercise their own judgment in trading.
Join our private Facebook group for additional insight into trading and the futures markets!
Competition Details


#ES, #NQ, #YM, #RTY, #XBT, #GC, #SI, #CL, #ZB, #6E, #ZC, #ZW, #ZS, #ZM, #NG


This is not a solicitation of any order to buy or sell, but a current market view provided by Cannon Trading Inc. Any statement of facts herein contained are derived from sources believed to be reliable but are not guaranteed as to accuracy, nor they purport to be complete. No responsibility is assumed with respect to any such statement or with respect to any expression of opinion herein contained. Readers are urged to exercise their own judgment in trading.
By Mark O’Brien, Senior Broker
General:
Thanks in large part to higher yield opportunities, foreign purchases of dollars to buy U.S. treasuries have pushed the U.S. Dollar Index (basis Dec.) to a 10-month high today – trading to an intraday high of 106.24 – a climb of over $7,000 per contract since mid-July. The Federal Reserve held interest rates steady at their September meeting, but chairman Powell reiterated the Central Bank’s goal of bringing inflation down to its 2% target, so further rate hikes were still on the table and “higher for longer,” remained the clarion call.
Currencies:
Conversely, the Euro hit 6-month lows today, down to 1.0538 intraday, marking a ±$9,500 per contract move in a little over two months. The Japanese yen is threatening its key 150 level, where Japanese officials are seen as potentially intervening to shore up the currency (divide the futures price by 1 to find the conversion rate).
Metals:
New highs in the dollar have also translated to new lows in precious metals, particularly gold, which lost ±$29 per ounce today (basis Dec.) and broke through $1,900 per ounce, approaching early-February lows near $1883. This is a ±$225 per ounce decline (±$22,500 per contract) from its May 4 highs.
Energies:
Despite China’s tenuous economy – a key measure of demand for crude oil globally – the supply side of the ledger has been the driving force behind rising energy prices. Production cuts made by OPEC+ and continuing through year’s end have contributed to a plunge in storage levels in Europe and the U.S. to multi-month lows. Today the Energy Information Administration reported a crude oil inventory draw of 2.2 million barrels for the week to September 22, spurring a ±$3.50 per barrel advance above $94.00 per barrel intraday (basis Nov.) Yesterday, the American Petroleum Institute estimated that stocks at the Cushing, Oklahoma hub – where West Texas oil futures deliveries are processed – had slipped to below 22 million barrels, which is on the brink of the minimum operating level for that important terminal. The crude oil tanks around Cushing have approximately 91 million barrels of storage capacity.
Summary:
Futures traders remember the practical rule of thumb to keep an eye on the U.S. dollar. A stronger dollar in the global market will increase the price of commodities relative to foreign currencies. The higher price of commodities in foreign currency will work to lower demand and dollar-priced commodities. For a first-rate overview, check out the piece by Hannah Baldwin with the CME Group and contributed to Reuters: “How a strong dollar affects international currencies & commodities.”
Trading Futures, Options on Futures, and retail off-exchange foreign currency transactions involves substantial risk of loss and is not suitable for all investors. You should carefully consider whether trading is suitable for you in light of your circumstances, knowledge, and financial resources. You may lose all or more of your initial investment. Opinions, market data, and recommendations are subject to change at any time when it comes to Futures Trading.
09-28-2023

#ES, #NQ, #YM, #RTY, #XBT, #GC, #SI, #CL, #ZB, #6E, #ZC, #ZW, #ZS, #ZM, #NG

This is not a solicitation of any order to buy or sell, but a current market view provided by Cannon Trading Inc. Any statement of facts here in contained are derived from sources believed to be reliable, but are not guaranteed as to accuracy, nor they purport to be complete. No responsibility is assumed with respect to any such statement or with respect to any expression of opinion herein contained. Readers are urged to exercise their own judgement in trading.
Join our private Facebook group for additional insight into trading and the futures markets!
Competition Details


#ES, #NQ, #YM, #RTY, #XBT, #GC, #SI, #CL, #ZB, #6E, #ZC, #ZW, #ZS, #ZM, #NG


This is not a solicitation of any order to buy or sell, but a current market view provided by Cannon Trading Inc. Any statement of facts herein contained are derived from sources believed to be reliable but are not guaranteed as to accuracy, nor they purport to be complete. No responsibility is assumed with respect to any such statement or with respect to any expression of opinion herein contained. Readers are urged to exercise their own judgment in trading.
Start: October 15th at 5:00 PM CT
End: October 27th at 4:00 PM CT
Prizes (Cash Prizes!!)
First Place: $2500
Second Place: $1000
Third Place: $650
Random Selection: $500
Competition Details
Trading Futures, Options on Futures, and retail off-exchange foreign currency transactions involves substantial risk of loss and is not suitable for all investors. You should carefully consider whether trading is suitable for you in light of your circumstances, knowledge, and financial resources. You may lose all or more of your initial investment. Opinions, market data, and recommendations are subject to change at any time when it comes to Futures Trading.
09-21-2023

#ES, #NQ, #YM, #RTY, #XBT, #GC, #SI, #CL, #ZB, #6E, #ZC, #ZW, #ZS, #ZM, #NG
This is not a solicitation of any order to buy or sell, but a current market view provided by Cannon Trading Inc. Any statement of facts here in contained are derived from sources believed to be reliable, but are not guaranteed as to accuracy, nor they purport to be complete. No responsibility is assumed with respect to any such statement or with respect to any expression of opinion herein contained. Readers are urged to exercise their own judgement in trading.
Volume in the September contracts will begin to drop off until their expiration Friday, September 15th (8:30 A.M., Central Time). At that point, trading in these contracts halts. Stock index futures are CASH SETTLED contracts. If you hold any September futures contracts through 8:30 A.M., Central Time on Friday, Sept. 15th, they will be offset with the cash settlement price, as set by the exchange.
Monday, September 18th is Last Trading Day for September currency futures. It is of the utmost importance for currency traders to exit all September futures contracts by Friday, September 15th and to start trading the December futures. Currency futures are DELIVERABLE contracts.
The month code for December is ‘Z.’ Please consider carefully how you place orders when changing over.
Watch the video below on how to rollover your market depth and charts!
Trading Futures, Options on Futures, and retail off-exchange foreign currency transactions involves substantial risk of loss and is not suitable for all investors. You should carefully consider whether trading is suitable for you in light of your circumstances, knowledge, and financial resources. You may lose all or more of your initial investment. Opinions, market data, and recommendations are subject to change at any time when it comes to Futures Trading.
09-13-2023

#ES, #NQ, #YM, #RTY, #XBT, #GC, #SI, #CL, #ZB, #6E, #ZC, #ZW, #ZS, #ZM, #NG
This is not a solicitation of any order to buy or sell, but a current market view provided by Cannon Trading Inc. Any statement of facts here in contained are derived from sources believed to be reliable, but are not guaranteed as to accuracy, nor they purport to be complete. No responsibility is assumed with respect to any such statement or with respect to any expression of opinion herein contained. Readers are urged to exercise their own judgement in trading.
|
 |
|
Trading Futures, Options on Futures, and retail off-exchange foreign currency transactions involves substantial risk of loss and is not suitable for all investors. You should carefully consider whether trading is suitable for you in light of your circumstances, knowledge, and financial resources. You may lose all or more of your initial investment. Opinions, market data, and recommendations are subject to change at any time when it comes to Futures Trading.
09-07-2023


This is not a solicitation of any order to buy or sell, but a current market view provided by Cannon Trading Inc. Any statement of facts here in contained are derived from sources believed to be reliable, but are not guaranteed as to accuracy, nor they purport to be complete. No responsibility is assumed with respect to any such statement or with respect to any expression of opinion herein contained. Readers are urged to exercise their own judgement in trading.
by Ilan Levy-Mayer, VP
Trading Futures, Options on Futures, and retail off-exchange foreign currency transactions involves substantial risk of loss and is not suitable for all investors. You should carefully consider whether trading is suitable for you in light of your circumstances, knowledge, and financial resources. You may lose all or more of your initial investment. Opinions, market data, and recommendations are subject to change at any time when it comes to Futures Trading.
09-06-2023

#ES, #NQ, #YM, #RTY, #XBT, #GC, #SI, #CL, #ZB, #6E, #ZC, #ZW, #ZS, #ZM, #NG

This is not a solicitation of any order to buy or sell, but a current market view provided by Cannon Trading Inc. Any statement of facts here in contained are derived from sources believed to be reliable, but are not guaranteed as to accuracy, nor they purport to be complete. No responsibility is assumed with respect to any such statement or with respect to any expression of opinion herein contained. Readers are urged to exercise their own judgement in trading.
by Mark O’Brien, Senior Broker
General:
As the duel between the United States and China continues, seemingly on several fronts, a new sign emerged the first half of the year: China’s imports to the U.S. accounted for the smallest percentage of goods arriving here in 20 years. Just 13.3% of all imports to the U.S. came from China the first half of 2023. Compare that to its peak of 21.6% for all of 2017 and its low point of 12.1% in 2013. The downturn is not due to any list of stand-out products or industries, nor has any country or small number of countries jumped up to import a bigger share of anything. Rather, slow-moving supply chain shifts across dozens of industries and nations are driving the trend. When the dollar values of exports and imports are combined, Mexico is now America’s no. 1 trading partner, followed by Canada, pushing China to third place.
Last Thursday, the Labor Department reported the consumer-price index increased 0.2% in July, the same as in June. That is down sharply year-over-year looking at the 1.2% gain in June 2022. If the downward trend continues – now over a year from its June 2022 peak reading of 9.1%, inflation is on a path to draw near the Federal Reserve’s 2% target by late 2023 or early 2024.
What could stand in the way of that trend? Geopolitical events and weather could impact food and energy prices.
After Saudi Arabia and Russia announced reductions in their oil production last month, unleaded gas prices, which tend to lag behind crude oil prices, traded to 1-year highs on Friday (basis September) within less than two cents of $3.00 per gallon.
Further regarding Russia, last month it withdrew from a deal that allowed Ukraine to export grain through the Black Sea and has since attacked key port facilities in Odesa. Ukraine is one of the world’s largest grain suppliers including 13% of global corn exports and the 12% of wheat.
Add to all this, scientists watching the periodic climate pattern called El Niño are now anticipating it arriving this winter more likely as “moderate,” and possibly a “strong” event than how they assessed conditions in May. Ocean surface temperatures in the central Pacific Ocean have warmed enough off the coast of South America to trigger an El Niño, meaning possibly a warmer, dryer winter here in the U.S. and higher temperatures globally. This can cause disruptions to crops in some of the world’s most important commodities sources.

Trading Futures, Options on Futures, and retail off-exchange foreign currency transactions involves substantial risk of loss and is not suitable for all investors. You should carefully consider whether trading is suitable for you in light of your circumstances, knowledge, and financial resources. You may lose all or more of your initial investment. Opinions, market data, and recommendations are subject to change at any time when it comes to Futures Trading.
08-15-2023

#ES, #NQ, #YM, #RTY, #XBT, #GC, #SI, #CL, #ZB, #6E, #ZC, #ZW, #ZS, #ZM, #NG
This is not a solicitation of any order to buy or sell, but a current market view provided by Cannon Trading Inc. Any statement of facts here in contained are derived from sources believed to be reliable, but are not guaranteed as to accuracy, nor they purport to be complete. No responsibility is assumed with respect to any such statement or with respect to any expression of opinion herein contained. Readers are urged to exercise their own judgement in trading.
Join our private Facebook group for additional insight into trading and the futures markets!
Have a safe Memorial Day Weekend. Trading Schedule HERE


#ES, #NQ, #YM, #RTY, #XBT, #GC, #SI, #CL, #ZB, #6E, #ZC, #ZW, #ZS, #ZM, #NG
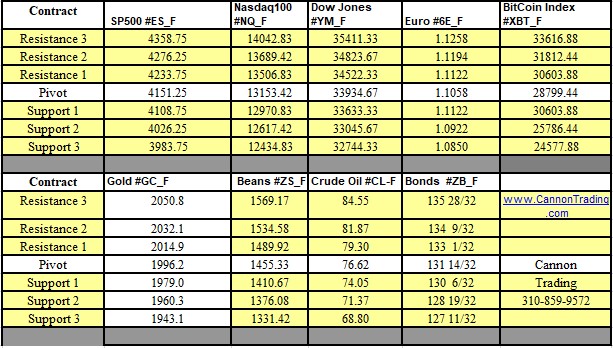
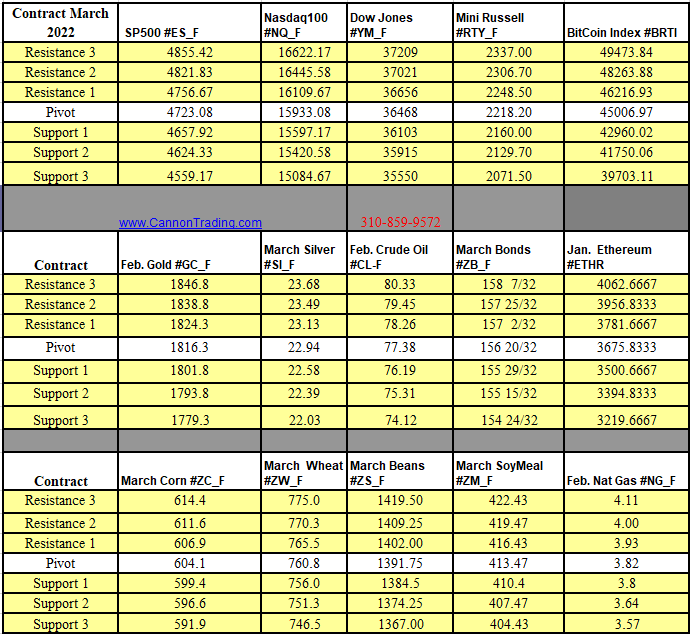
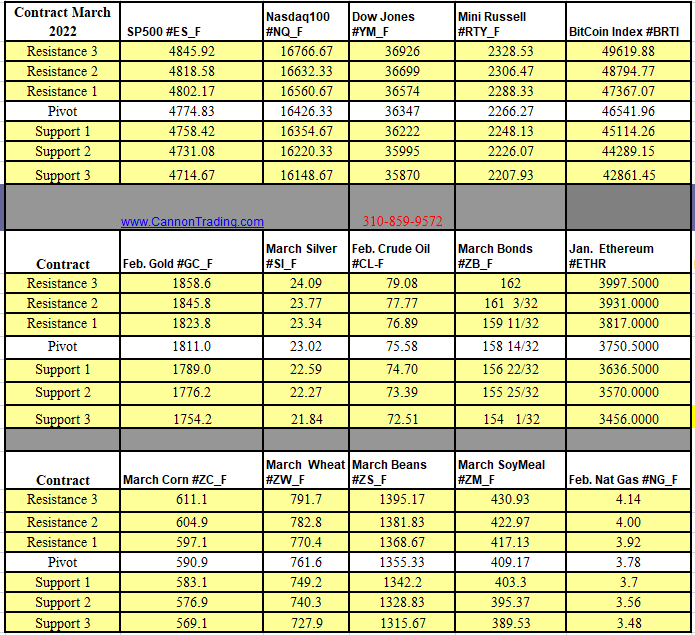
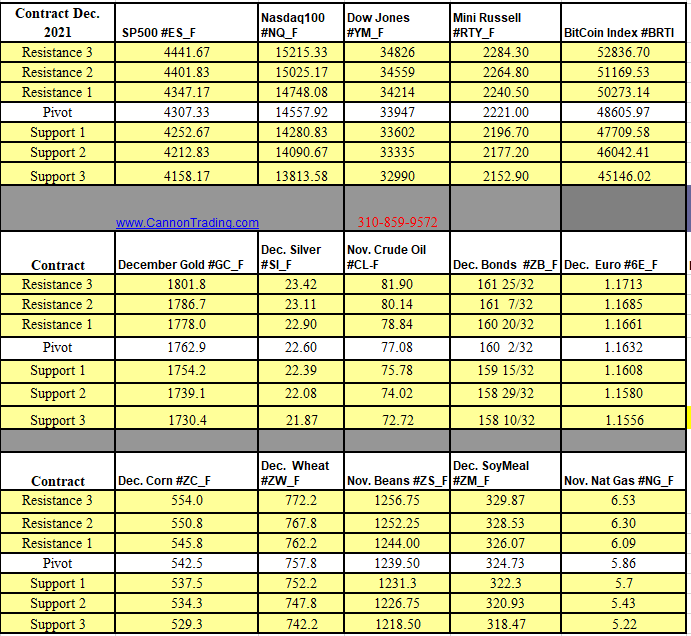
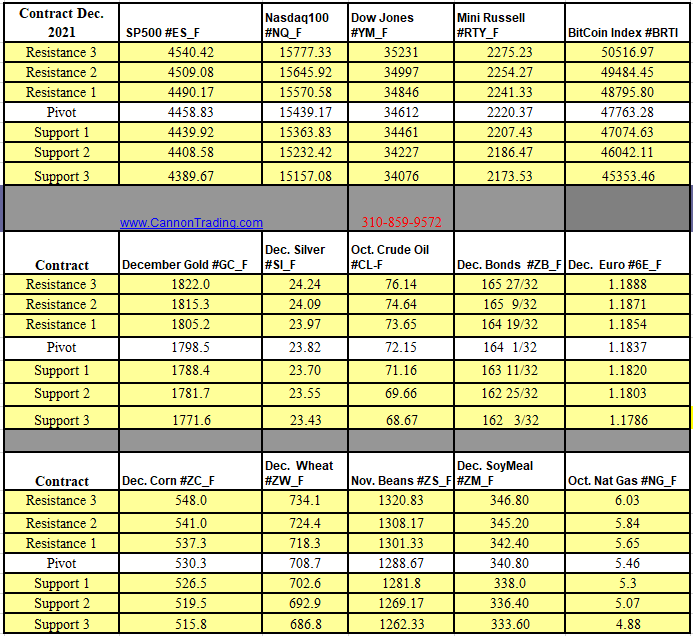
Weekly Levels


This is not a solicitation of any order to buy or sell, but a current market view provided by Cannon Trading Inc. Any statement of facts herein contained are derived from sources believed to be reliable but are not guaranteed as to accuracy, nor they purport to be complete. No responsibility is assumed with respect to any such statement or with respect to any expression of opinion herein contained. Readers are urged to exercise their own judgment in trading.
General:
The answer is: Germany, Denmark, Netherlands, Sweden, Norway, Switzerland, Luxembourg, Singapore and Australia.
The question is: name the remaining countries whose credit is rated AAA by all three ratings companies – S&P Global, Fitch and Moody’s – after Fitch downgraded the United States’ debt rating from its top-tier AAA, down to AA+.
Among the contributing factors leading to the downgrade, Fitch cited, “the expected fiscal deterioration over the next three years, a high and growing general government debt burden, and the erosion of governance . . . that has manifested in repeated debt limit standoffs and last-minute resolutions.”
Remember in 2011, even though at that time a debt-limit deal was reached, S&P Global lowered the U.S.’s credit rating from AAA down to AA+ and it has not recovered since.
Canada is rated AAA by two of the ratings companies.
Stock Indexes:
Probably not surprisingly, as of this typing, stock indexes reacted negatively to the ratings news with the E-mini Dow Jones losing more than 300 points, roughly a 2% haircut. The E-mini Nasdaq is off ±325 points, a similar 2% correction.
Energy:
As the stock market foundered, crude oil felt weak in the knees as well and by mid-session, the September contract had sold off $3.00 per barrel from its Sunday opening. This despite today’s EIA crude oil stocks report showing a 17 million barrel reduction in U.S. crude stocks; the largest drop in inventories since 1982.
Grains:
After trading within 13 cents of its April 2022 highs last week, November soybeans factored in an expected conga line of wet weather fronts moving broadly over the U.S. Midwest and sold off ±$1.00 down to ±$13.25/bushel, a $5,000 per contract move, the bulk of which comprised just three trading sessions. Estimates for this year’s crop are a virtual wild card given the approach of August, its most critical growing period, so expect volatile price movement throughout.
Trading Futures, Options on Futures, and retail off-exchange foreign currency transactions involves substantial risk of loss and is not suitable for all investors. You should carefully consider whether trading is suitable for you in light of your circumstances, knowledge, and financial resources. You may lose all or more of your initial investment. Opinions, market data, and recommendations are subject to change at any time when it comes to Futures Trading.
08-03-2023

#ES, #NQ, #YM, #RTY, #XBT, #GC, #SI, #CL, #ZB, #6E, #ZC, #ZW, #ZS, #ZM, #NG
This is not a solicitation of any order to buy or sell, but a current market view provided by Cannon Trading Inc. Any statement of facts here in contained are derived from sources believed to be reliable, but are not guaranteed as to accuracy, nor they purport to be complete. No responsibility is assumed with respect to any such statement or with respect to any expression of opinion herein contained. Readers are urged to exercise their own judgement in trading.
By Mark O’Brien, Senior Broker
General:
As expected, today Federal Reserve officials raised interest rates by 25 basis points. This puts the Federal Funds Rate – the central bank’s key borrowing rate – at a range of 5.25 to 5.50. This is the highest level at which Fed Funds have been set since 2001. The vote was unanimous among the Fed governors to take this latest step in the bank’s efforts to rein in inflation and cool the economy. This increase is the latest in the fed’s months-long effort to rachet up borrowing costs resulting in a reduction in demand for goods, services and labor in the economy.
WTI crude oil has been repeatedly plumbing its lows of the year between $67 and $70 per barrel the entire second quarter. Yesterday it traded within 10 cents of $80.00 per barrel intraday (basis Sept.) to 3-month highs – a solid ±$12 per barrel move this month; a ±$12,000 per contract move. Analysts largely attribute the increase to recently announced output cuts by Saudi Arabia and Russia.
September soybeans traded up 21 ¼ cents today to this crop year’s and life-of-contract highs, closing at $15.56 ½ per bushel. The current rally off it’s late-May lows just above $12.00 per bushel (a ±$17,500 per contract move) reflect the continued sentiment that U.S. soybean crop conditions will continue to deteriorate as harvest approaches.
Plan your trade and trade your plan.
Trading Futures, Options on Futures, and retail off-exchange foreign currency transactions involves substantial risk of loss and is not suitable for all investors. You should carefully consider whether trading is suitable for you in light of your circumstances, knowledge, and financial resources. You may lose all or more of your initial investment. Opinions, market data, and recommendations are subject to change at any time when it comes to Futures Trading.
for 07-27-2023

#ES, #NQ, #YM, #RTY, #XBT, #GC, #SI, #CL, #ZB, #6E, #ZC, #ZW, #ZS, #ZM, #NG

This is not a solicitation of any order to buy or sell, but a current market view provided by Cannon Trading Inc. Any statement of facts here in contained are derived from sources believed to be reliable, but are not guaranteed as to accuracy, nor they purport to be complete. No responsibility is assumed with respect to any such statement or with respect to any expression of opinion herein contained. Readers are urged to exercise their own judgement in trading.
By Mark O’Brien, Senior Broker
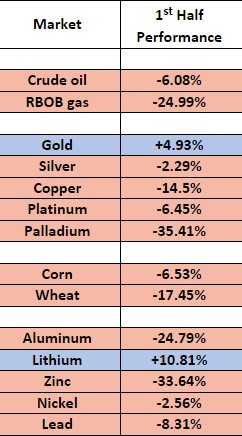
Taking a look at a relatively bigger picture of the world’s growth – or lack thereof – below you’ll find a list of natural resource commodities and their performance over the first half of the year.
The list is certainly metals-centric and no softs (cocoa, sugar, cotton, coffee, orange juice) or livestock were included. Nevertheless, it illustrates the broad theme of the global economy, in which the world’s leading demand engine – China – has experienced at best a sputtering recovery after nearly three years of pandemic-related falloff.
Notice just two: lithium and gold were the only ones heading into the second half of 2023 with positive returns.
Noteworthy is gold’s hold on to positive returns attributable to the relatively stable U.S. dollar and steady demand by the world’s central banks, which is likely to persist as long as the risk of recession remains for the big players – China, Europe and the U.S. – and high-quality, liquid assets remain desirable. Compare gold to crude oil, which despite output cuts by OPEC+ countries and forecasts for demand to continue outpacing supply into 2024, has stayed negatively impacted by stalled economies.
Plan your trade and trade your plan.
Watch video below on ways to project exits on trades.
Trading Futures, Options on Futures, and retail off-exchange foreign currency transactions involves substantial risk of loss and is not suitable for all investors. You should carefully consider whether trading is suitable for you in light of your circumstances, knowledge, and financial resources. You may lose all or more of your initial investment. Opinions, market data, and recommendations are subject to change at any time when it comes to Futures Trading.
for 07-13-2023

#ES, #NQ, #YM, #RTY, #XBT, #GC, #SI, #CL, #ZB, #6E, #ZC, #ZW, #ZS, #ZM, #NG
This is not a solicitation of any order to buy or sell, but a current market view provided by Cannon Trading Inc. Any statement of facts here in contained are derived from sources believed to be reliable, but are not guaranteed as to accuracy, nor they purport to be complete. No responsibility is assumed with respect to any such statement or with respect to any expression of opinion herein contained. Readers are urged to exercise their own judgement in trading.
Join our private Facebook group for additional insight into trading and the futures markets!
Have a safe Memorial Day Weekend. Trading Schedule HERE
Trading Resource of the Week –

A Cannon broker will be able to assist, provide feedback and answer any questions.


#ES, #NQ, #YM, #RTY, #XBT, #GC, #SI, #CL, #ZB, #6E, #ZC, #ZW, #ZS, #ZM, #NG
Weekly Levels


This is not a solicitation of any order to buy or sell, but a current market view provided by Cannon Trading Inc. Any statement of facts herein contained are derived from sources believed to be reliable but are not guaranteed as to accuracy, nor they purport to be complete. No responsibility is assumed with respect to any such statement or with respect to any expression of opinion herein contained. Readers are urged to exercise their own judgment in trading.
Join our private Facebook group for additional insight into trading and the futures markets!
A Cannon broker will be able to assist, provide feedback and answer any questions.

#ES, #NQ, #YM, #RTY, #XBT, #GC, #SI, #CL, #ZB, #6E, #ZC, #ZW, #ZS, #ZM, #NG
Weekly Levels
This is not a solicitation of any order to buy or sell, but a current market view provided by Cannon Trading Inc. Any statement of facts herein contained are derived from sources believed to be reliable but are not guaranteed as to accuracy, nor they purport to be complete. No responsibility is assumed with respect to any such statement or with respect to any expression of opinion herein contained. Readers are urged to exercise their own judgment in trading
By Mark O’Brien, Senior broker
General
Count ‘em: nine in a row. That’s how many meetings the Federal Reserve has increased its key interest rate. As of today’s .25-point increase, the federal funds rate target range stands at 4.75%-5.00%, the highest level since September 2007. The vote by all 11 members of the Federal Open Market Committee was unanimous. Clearly, the bank runs that toppled Silicon Vally Bank and roiled the banking industry have been front and center in the financial world the last two weeks, but the situation fazed Fed officials little if at all. “The U.S. banking system is sound and resilient,” said the prepared policy statement released at 1:00 P.M., Central Time today. Fighting inflation, it seems, remains the Central Bank’s focus.
Metals
On Monday, gold futures (basis April) pierced through $2,000 per ounce intraday for the first time in a year as the U.S. banking crisis spread to Europe with Credit Suisse, a preeminent name in global investment banking, sought help from Switzerland’s central bank and then put itself up for sale. This marked a ±$18,000 per 100-oz. futures contract move in just eight trading sessions from March 9.
Grains
Wheat continued its ±8-month slide from its multi-year spike high above $13/bushel on the heels of Russia’s invasion of Ukraine to lows not seen since July ’21 as traders see improvement in U.S. winter wheat crop conditions and a lack of significant weather issues across key northern hemisphere wheat producers. The front month May contract closed today at it’s life-of-contract low of $6.22 ¾ per bushel.
Energy
Crude oil continued its almost 9-month decline in prices from over $120 per barrel last June to trade below $65 per barrel (basis May) on Monday, including a ±$15 / $15,000 per contract fall from March 7, scarcely two weeks.
Natural gas basis its May futures contract tested 32-month lows yesterday, threatening to punch through $2.00 per million British thermal units (MMBtu). With the North American winter heating season approaching its end, residential, commercial, and industrial gas demand has been on the decline.

Plan your trade and trade your plan.
Trading Futures, Options on Futures, and retail off-exchange foreign currency transactions involves substantial risk of loss and is not suitable for all investors. You should carefully consider whether trading is suitable for you in light of your circumstances, knowledge, and financial resources. You may lose all or more of your initial investment. Opinions, market data, and recommendations are subject to change at any time when it comes to Futures Trading.
for 03-23-2023

#ES, #NQ, #YM, #RTY, #XBT, #GC, #SI, #CL, #ZB, #6E, #ZC, #ZW, #ZS, #ZM, #NG
This is not a solicitation of any order to buy or sell, but a current market view provided by Cannon Trading Inc. Any statement of facts here in contained are derived from sources believed to be reliable, but are not guaranteed as to accuracy, nor they purport to be complete. No responsibility is assumed with respect to any such statement or with respect to any expression of opinion herein contained. Readers are urged to exercise their own judgement in trading.
Trade June indices as well as June currencies!
By Mark O’Brien, Senior broker
Crude oil futures prices plunged more than $5.50 a barrel intraday today – touching a low of $65.65 (basis April) – to their lowest in more than a year as news that Credit Suisse’s biggest shareholder, Saudi National Bank, said it would not make further investments in the firm, sending the Swiss lender’s stock plunging ±27% and adding to the already extreme turmoil in the banking sector from the collapse of Silicon Valley Bank and Signature Bank last week here in the U.S.
In turn, gold futures prices climbed over 1% intraday with the April contract topping $1,942.50 per ounce intraday, it’s highest price since early February. Conversely, Copper futures lost ±11 cents / pound – over 4% intraday – with the May futures contract touching $3.84 / lb. matching prices from early January and extending a near month-long ±40-cent / $10,000 decline.
Not surprisingly, with the banking sector hitting rough seas this last week, treasuries have once again assumed their safe-haven status with the 30-yr. T-bond futures contract soaring ±10 full basis points ±$10,000 over the last nine trading days to March 3 and sending the benchmark 10-year Treasury note yield tumbling to near 3.5%
Significant volatility looks to be the order of the day for the near term across the major financial futures sectors – stock indexes, interest rates, currencies – as well as metals and energies. Up next, the FOMC meeting this coming Tuesday/Wednesday.
Be Careful out there, Plan your trade and trade your plan!
Trading Futures, Options on Futures, and retail off-exchange foreign currency transactions involves substantial risk of loss and is not suitable for all investors. You should carefully consider whether trading is suitable for you in light of your circumstances, knowledge, and financial resources. You may lose all or more of your initial investment. Opinions, market data, and recommendations are subject to change at any time when it comes to Futures Trading.
03-16-2023

#ES, #NQ, #YM, #RTY, #XBT, #GC, #SI, #CL, #ZB, #6E, #ZC, #ZW, #ZS, #ZM, #NG
This is not a solicitation of any order to buy or sell, but a current market view provided by Cannon Trading Inc. Any statement of facts here in contained are derived from sources believed to be reliable, but are not guaranteed as to accuracy, nor they purport to be complete. No responsibility is assumed with respect to any such statement or with respect to any expression of opinion herein contained. Readers are urged to exercise their own judgement in trading.
By Mark O’Brien, Senior Broker
Energy:
After starting the year near $72 per barrel, by June, West Texas crude oil (Jan. ’23 futures contract) climbed to its highs above $108 per barrel. Today, Jan. crude oil traded to an intraday low of $71.75, a ±$36 per barrel (±$36,000) leap and fall.
Not to be out don’t, after breaching $10.00 per million British thermal units in early August, natural gas traded below $5.34 intraday yesterday, a whopping ±46% cut in the asset’s value and a ±$46,000 move for a single futures contract (Jan. ’23 futures contract).
Metals:
Albeit experiencing a slight correction this week so far, gold (Feb. ’23 futures contract) managed to hold nearly all of its ±$170 rally through $1,800 per ounce off its multi-year lows of early November near $1,635 per ounce – a ±$17,000 move in one month.
Announcements:
Keep an eye on the calendar for important U.S. government reports this Friday, starting with the Labor Department’s release of its Producer Price Index showing the cost of wholesale goods and services. The reading reflects what companies pay for supplies such as grains, fuel, metals, lumber, packaging and so forth. This is a key inflation gauge in the midst of four-decade high wholesale prices. Release time: 7:30 A.M., Central Time.
Also on Friday, the USDA will release its Crop Production Report along with its World Supply/Demand report (likely the more critical). It’s delivered at 11:00 A.M., Central Time.
A Cannon broker will be able to assist, provide feedback and answer any questions.
Trading Futures, Options on Futures, and retail off-exchange foreign currency transactions involves substantial risk of loss and is not suitable for all investors. You should carefully consider whether trading is suitable for you in light of your circumstances, knowledge, and financial resources. You may lose all or more of your initial investment. Opinions, market data, and recommendations are subject to change at any time when it comes to Futures Trading.
for 12-08-2022

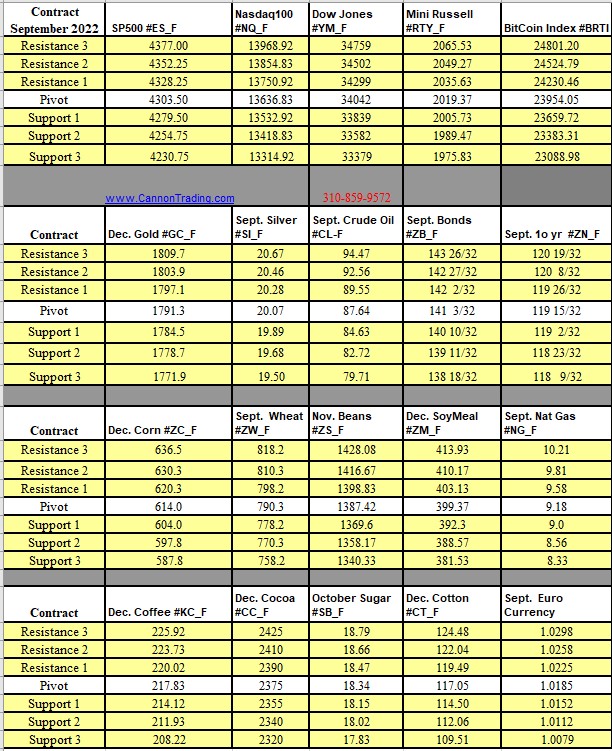
SP500 #ES_FNasdaq100 #NQ_FDow Jones #YM_FMini Russell #RTY_FBitCoin Index #BRTI SP500 Feb. Gold #GC_F March Silver #SI_F Jan. Crude Oil #CL-F March Bonds #ZB_F March 10 yr #ZN_F March Corn #ZC_F March Wheat #ZW_F March Beans #ZS_F March SoyMeal #ZM_F Jan. Nat Gas #NG_F March Coffee #KC_F March Cocoa #CC_F March Sugar #SB_F March Cotton #CT_F March Euro Currency
This is not a solicitation of any order to buy or sell, but a current market view provided by Cannon Trading Inc. Any statement of facts here in contained are derived from sources believed to be reliable, but are not guaranteed as to accuracy, nor they purport to be complete. No responsibility is assumed with respect to any such statement or with respect to any expression of opinion herein contained. Readers are urged to exercise their own judgement in trading.
Dear Traders,

Trading Futures, Options on Futures, and retail off-exchange foreign currency transactions involves substantial risk of loss and is not suitable for all investors. You should carefully consider whether trading is suitable for you in light of your circumstances, knowledge, and financial resources. You may lose all or more of your initial investment. Opinions, market data, and recommendations are subject to change at any time when it comes to Futures Trading.
08-16-2022


This is not a solicitation of any order to buy or sell, but a current market view provided by Cannon Trading Inc. Any statement of facts herein contained are derived from sources believed to be reliable but are not guaranteed as to accuracy, nor they purport to be complete. No responsibility is assumed with respect to any such statement or with respect to any expression of opinion herein contained. Readers are urged to exercise their own judgment in trading

Trading Futures, Options on Futures, and retail off-exchange foreign currency transactions involves substantial risk of loss and is not suitable for all investors. You should carefully consider whether trading is suitable for you in light of your circumstances, knowledge, and financial resources. You may lose all or more of your initial investment. Opinions, market data, and recommendations are subject to change at any time when it comes to Futures Trading.
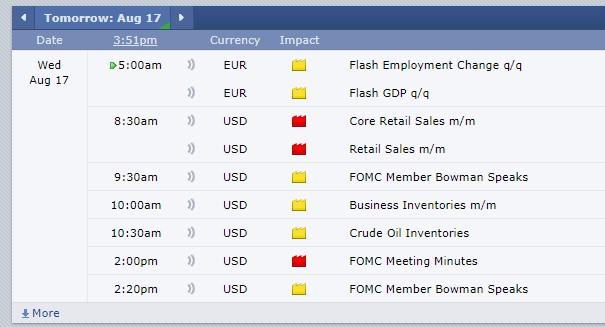
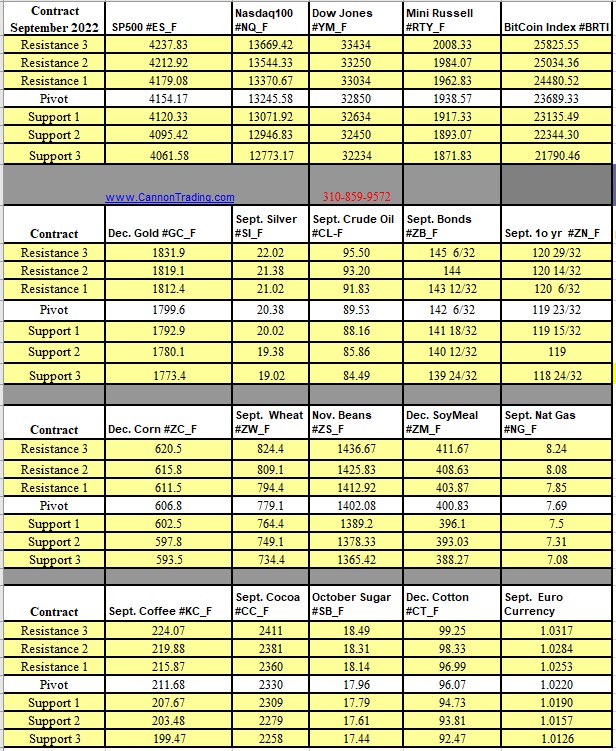
08-17-2022
This is not a solicitation of any order to buy or sell, but a current market view provided by Cannon Trading Inc. Any statement of facts here in contained are derived from sources believed to be reliable, but are not guaranteed as to accuracy, nor they purport to be complete. No responsibility is assumed with respect to any such statement or with respect to any expression of opinion herein contained. Readers are urged to exercise their own judgement in trading.
Trading Futures, Options on Futures, and retail off-exchange foreign currency transactions involves substantial risk of loss and is not suitable for all investors. You should carefully consider whether trading is suitable for you in light of your circumstances, knowledge, and financial resources. You may lose all or more of your initial investment. Opinions, market data, and recommendations are subject to change at any time when it comes to Futures Trading.
08-08-2022

This is not a solicitation of any order to buy or sell, but a current market view provided by Cannon Trading Inc. Any statement of facts here in contained are derived from sources believed to be reliable, but are not guaranteed as to accuracy, nor they purport to be complete. No responsibility is assumed with respect to any such statement or with respect to any expression of opinion herein contained. Readers are urged to exercise their own judgement in trading.

Trading Futures, Options on Futures, and retail off-exchange foreign currency transactions involves substantial risk of loss and is not suitable for all investors. You should carefully consider whether trading is suitable for you in light of your circumstances, knowledge, and financial resources. You may lose all or more of your initial investment. Opinions, market data, and recommendations are subject to change at any time when it comes to Futures Trading.
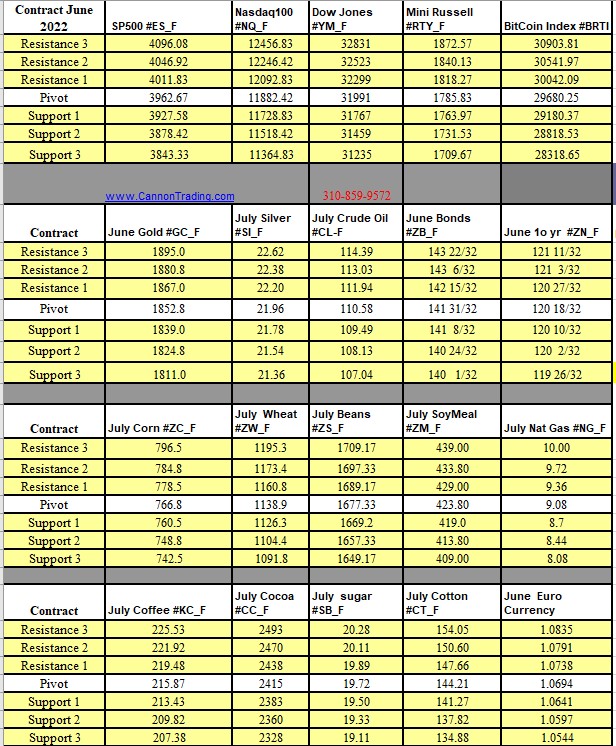
05-25-2022
This is not a solicitation of any order to buy or sell, but a current market view provided by Cannon Trading Inc. Any statement of facts here in contained are derived from sources believed to be reliable, but are not guaranteed as to accuracy, nor they purport to be complete. No responsibility is assumed with respect to any such statement or with respect to any expression of opinion herein contained. Readers are urged to exercise their own judgement in trading.
|
|
01-06-2022

Trading Futures, Options on Futures, and retail off-exchange foreign currency transactions involves substantial risk of loss and is not suitable for all investors. You should carefully consider whether trading is suitable for you in light of your circumstances, knowledge, and financial resources. You may lose all or more of your initial investment. Opinions, market data, and recommendations are subject to change at any time when it comes to Futures Trading.
This is not a solicitation of any order to buy or sell, but a current market view provided by Cannon Trading Inc. Any statement of facts here in contained are derived from sources believed to be reliable, but are not guaranteed as to accuracy, nor they purport to be complete. No responsibility is assumed with respect to any such statement or with respect to any expression of opinion herein contained. Readers are urged to exercise their own judgement in trading.

Trading Futures, Options on Futures, and retail off-exchange foreign currency transactions involves substantial risk of loss and is not suitable for all investors. You should carefully consider whether trading is suitable for you in light of your circumstances, knowledge, and financial resources. You may lose all or more of your initial investment. Opinions, market data, and recommendations are subject to change at any time when it comes to Futures Trading.
01-04-2022
This is not a solicitation of any order to buy or sell, but a current market view provided by Cannon Trading Inc. Any statement of facts here in contained are derived from sources believed to be reliable, but are not guaranteed as to accuracy, nor they purport to be complete. No responsibility is assumed with respect to any such statement or with respect to any expression of opinion herein contained. Readers are urged to exercise their own judgement in trading.
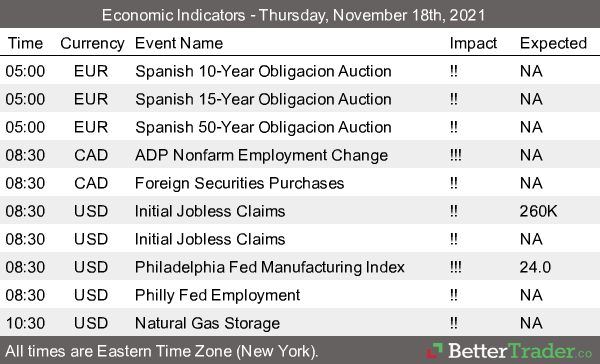
Dear Futures Trader,

Trading Futures, Options on Futures, and retail off-exchange foreign currency transactions involves substantial risk of loss and is not suitable for all investors. You should carefully consider whether trading is suitable for you in light of your circumstances, knowledge, and financial resources. You may lose all or more of your initial investment. Opinions, market data, and recommendations are subject to change at any time when it comes to Futures Trading.
11-18-2021

This is not a solicitation of any order to buy or sell, but a current market view provided by Cannon Trading Inc. Any statement of facts here in contained are derived from sources believed to be reliable, but are not guaranteed as to accuracy, nor they purport to be complete. No responsibility is assumed with respect to any such statement or with respect to any expression of opinion herein contained. Readers are urged to exercise their own judgement in trading.
Dear Traders,

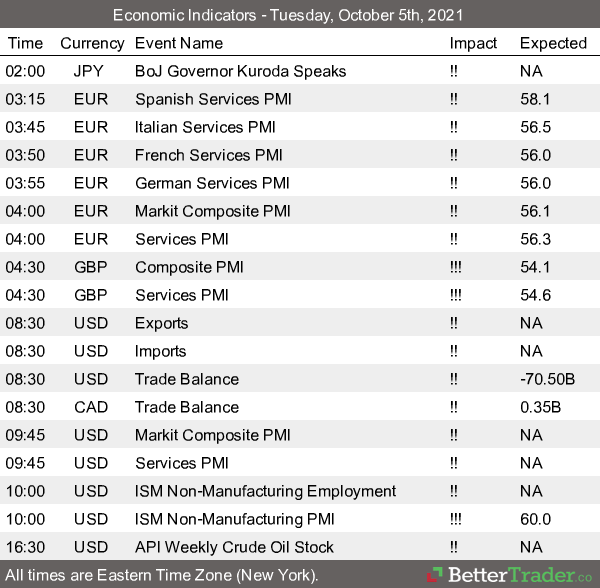
10-05-2021
This is not a solicitation of any order to buy or sell, but a current market view provided by Cannon Trading Inc. Any statement of facts here in contained are derived from sources believed to be reliable, but are not guaranteed as to accuracy, nor they purport to be complete. No responsibility is assumed with respect to any such statement or with respect to any expression of opinion herein contained. Readers are urged to exercise their own judgement in trading as well as options on futures.
Dear Traders,

Trading Futures, Options on Futures, and retail off-exchange foreign currency transactions involves substantial risk of loss and is not suitable for all investors. You should carefully consider whether trading is suitable for you in light of your circumstances, knowledge, and financial resources. You may lose all or more of your initial investment. Opinions, market data, and recommendations are subject to change at any time when it comes to Futures Trading.
9-16-2021

This is not a solicitation of any order to buy or sell, but a current market view provided by Cannon Trading Inc. Any statement of facts here in contained are derived from sources believed to be reliable, but are not guaranteed as to accuracy, nor they purport to be complete. No responsibility is assumed with respect to any such statement or with respect to any expression of opinion herein contained. Readers are urged to exercise their own judgement in trading as well as options on futures.
Dear Traders,

Trading Futures, Options on Futures, and retail off-exchange foreign currency transactions involves substantial risk of loss and is not suitable for all investors. You should carefully consider whether trading is suitable for you in light of your circumstances, knowledge, and financial resources. You may lose all or more of your initial investment. Opinions, market data, and recommendations are subject to change at any time when it comes to Futures Trading.
5-21-2021


This is not a solicitation of any order to buy or sell, but a current market view provided by Cannon Trading Inc. Any statement of facts here in contained are derived from sources believed to be reliable, but are not guaranteed as to accuracy, nor they purport to be complete. No responsibility is assumed with respect to any such statement or with respect to any expression of opinion herein contained. Readers are urged to exercise their own judgement in trading.
Tips for day trading NYMEX crude oil futures
By Ilan Levy-Mayer, VP Cannon Trading Co, Inc.
When it comes to day trading futures contracts, crude oil futures are assumed one of the leading positions as far as trading volume.
During the month of May 2018, crude oil futures averaged around 1 Million contracts traded per day! That actually surpasses contracts like the ten-year notes, mini SP, mini Nasdaq and others who have traditionally been leaders’ in terms of volume.
Part of the growth in crude oil futures is attributed to day trader participation. Day traders, by definition, will enter and exit their positions during the same trading day. This adds volume to the market traded.
Some of the tips I am sharing below can be applied to most futures contracts as well as other financial products that are traded like stocks, forex, bonds and others. Some of the advice I am sharing is very specific to the crude oil futures trading field.
For example: A move from 72.10 to 73.10 = $1,000 and a move from 72.10 to 72.11 = $10 (the minimum fluctuation size or the tick size). Be aware that the CME also offers the mini crude contract, which is half the size.
Another key aspect to remember is that crude oil is a deliverable commodity and the “front month” will change every 30 days or so. For example: since May 22nd 2018 we have been trading July crude oil.
However, there are two major reports that move crude oil futures and its by-products (unleaded gasoline and heating oil) sharply: The API report, which comes out at 3:30 PM CST every Tuesday, and the DOE (Dept. of Energy) inventory numbers, which come out almost every Wednesday at 9:30AM CST.
Take a look at this one-minute chart from Wednesday, May 16th right around the report time below to understand the volatility involved.
As you can see above, the market made a move of $700 per ONE contract in a matter of minutes, perhaps even seconds! That type of risk and opportunity is one of the factors attracting day-traders into the crude oil market.
In my opinion crude oil (like many other markets) will have one of the following 3 modes: trending, two-sided volatility, or Choppy/quiet/range bound trading.
My experience is that crude will more often fall into the first 2 categories: strong trend or two-sided volatility. This leads me to my next point below, different trading set-ups.
My preferred methods for trading crude are either breakout concept in an attempt to catch a strong move up or down once the market broke some key support or resistance levels, AND/OR counter trend methods to take advantage of when the market is oversold or overbought. Crude does seem to bring more fear and greed out of traders. So looking at RSI levels, for example, and using moving averages ON the RSI to try and get a feel for market reversals are methods worth exploring.
Like with any other trading, keep a journal. Take notes on how the market reacted to certain reports, how the markets traded during certain times of the day, and action you took and emotions you had that either helped or hurt you while trading. These notes will help you going forward.
In summary, crude oil futures volume has increased significantly these past few years. The crude oil futures offer traders certain dynamics that other markets may not at certain times. Volatility, fear and greed are key traits for this market. Remember that trading crude oil futures specifically and futures and options in general carries a large degree of risk and is not suitable for all investors. Make sure you consult with a series 3 broker if you never traded this market before. As always, I wish you Good Trading!
Important: Trading commodity futures and options involves a substantial risk of loss.
The recommendations contained in this letter are of opinion only and do not guarantee any profits.
There is not an actual account trading these recommendations.
Past performances are not necessarily indicative of future results.
____________________________________________________________________
Voted #1 Blog and #1 Brokerage Services on TraderPlanet for 2016!!
____________________________________________________________________
|
Dear Traders,
|
By Blu Putnam, Chief Economist, CME Group
Unleaded Gasoline Daily Chart for your review below:
 If you like to set up a time and chat with a licensed series 3 broker, pleasecontact us. |
Good Trading
Trading Futures, Options on Futures, and retail off-exchange foreign currency transactions involves substantial risk of loss and is not suitable for all investors. You should carefully consider whether trading is suitable for you in light of your circumstances, knowledge, and financial resources. You may lose all or more of your initial investment. Opinions, market data, and recommendations are subject to change at any time.
Futures Trading Levels
05-15-2018
|
Futures Trading Levels
|
|
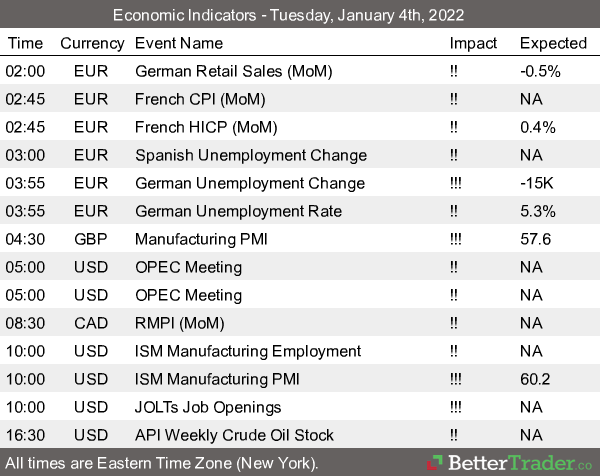
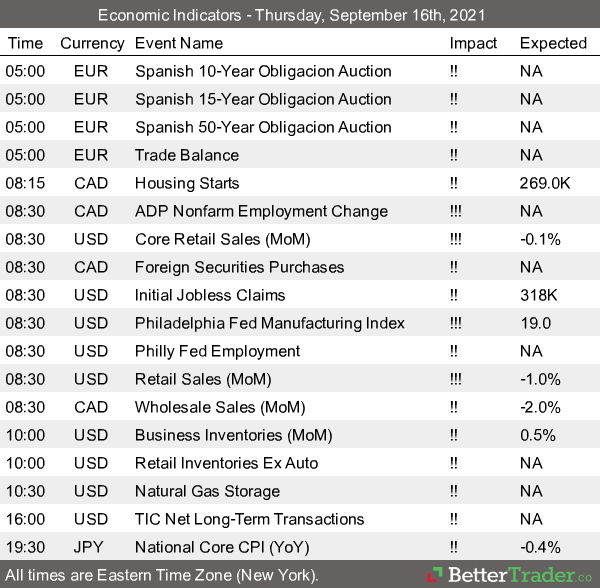
Economic Reports, source:
 |
This is not a solicitation of any order to buy or sell, but a current market view provided by Cannon Trading Inc. Any statement of facts here in contained are derived from sources believed to be reliable, but are not guaranteed as to accuracy, nor they purport to be complete. No responsibility is assumed with respect to any such statement or with respect to any expression of opinion herein contained. Readers are urged to exercise their own judgement in trading.
Hello Traders,
For 2014 I would like to wish all of you discipline and patience in your trading!
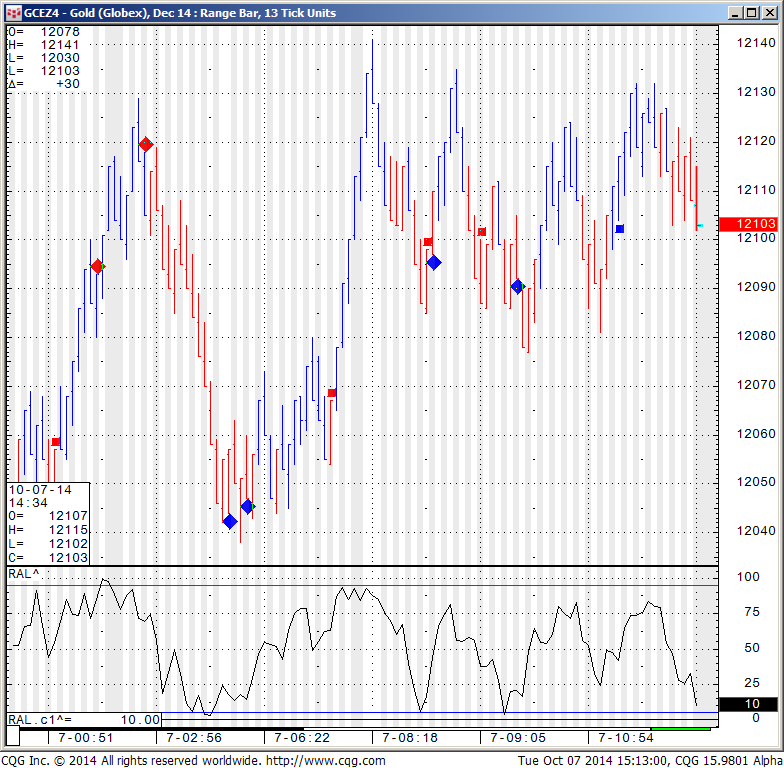
Another two markets I like to touch on when it comes to “other markets to daytrade beside the mini SP 500” are Crude Oil Futures and Gold futures.
More than a few similarities between the two markets.
They are both volatile, can move VERY fast. I have seen some very large moves happen in matter of minutes if not seconds. The “fear & greed” factor really plays a role in these specific two markets.
Both have active trading hours starting with Far East trading around 10 PM est all the way to the next morning until about 3 PM est. Good volume generally speaking but not close to the mini SP or ten year notes. So you may see some slippage on stops but the volume is more than enough to trade size.
Each tick on gold is $10, so every dollar move =$100 against you or in your favor. Crude is similar, each tick = $10. One full $1 move = $1000.
Both markets “traded what I consider average behavior” , the range on gold was $11 or = $1100 wide using one futures contract. Crude ranges today was less than $1.95 or about $1950 between hi/lo.
I like using overbought/ oversold indicators on the two markets as well as using range / Renko charts.
If you never traded these markets before, I highly recommend exploring in simulation/ demo mode. get a feel for the explosiveness, volatility, personality for a few weeks before trying in live mode.
As always, any questions, please feel free to email me.
Two charts from today’s session of gold and crude for your review below:
If you like Our Futures Trading Daily Support and Resistance Levels, Please share!
Futures Trading Levels
| Contract Dec. 2014 | SP500 | Nasdaq100 | Dow Jones | Mini Russell | Dollar Index |
| Resistance 3 | 1977.25 | 4052.25 | 17094 | 1103.50 | 86.70 |
| Resistance 2 | 1966.75 | 4031.25 | 16999 | 1096.90 | 86.46 |
| Resistance 1 | 1946.75 | 3992.25 | 16818 | 1084.50 | 86.12 |
| Pivot | 1936.25 | 3971.25 | 16723 | 1077.90 | 85.88 |
| Support 1 | 1916.25 | 3932.25 | 16542 | 1065.50 | 85.54 |
| Support 2 | 1905.75 | 3911.25 | 16447 | 1058.90 | 85.30 |
| Support 3 | 1885.75 | 3872.25 | 16266 | 1046.50 | 84.96 |
| Contract | December Gold | Dec.Silver | Nov. Crude Oil | Dec. Bonds | Dec. Euro |
| Resistance 3 | 1226.7 | 18.06 | 92.00 | 142 11/32 | 1.2805 |
| Resistance 2 | 1220.4 | 17.84 | 91.29 | 141 17/32 | 1.2747 |
| Resistance 1 | 1215.6 | 17.52 | 90.05 | 141 3/32 | 1.2707 |
| Pivot | 1209.3 | 17.30 | 89.34 | 140 9/32 | 1.2649 |
| Support 1 | 1204.5 | 16.98 | 88.10 | 139 27/32 | 1.2609 |
| Support 2 | 1198.2 | 16.76 | 87.39 | 139 1/32 | 1.2551 |
| Support 3 | 1193.4 | 16.44 | 86.15 | 138 19/32 | 1.2511 |
| Contract | Dec Corn | Dec. Wheat | Nov. Beans | Dec. SoyMeal | Dec. bean Oil |
| Resistance 3 | 352.3 | 506.7 | 973.00 | 327.87 | 33.86 |
| Resistance 2 | 346.7 | 506.6 | 963.75 | 322.33 | 33.69 |
| Resistance 1 | 343.6 | 506.4 | 952.25 | 317.77 | 33.40 |
| Pivot | 337.9 | 506.3 | 943.00 | 312.23 | 33.23 |
| Support 1 | 334.8 | 506.2 | 931.5 | 307.7 | 32.9 |
| Support 2 | 329.2 | 506.1 | 922.25 | 302.13 | 32.77 |
| Support 3 | 326.1 | 505.9 | 910.75 | 297.57 | 32.48 |
| Date | 4:08pm | Currency | Impact | Detail | Actual | Forecast | Previous | Graph | |
|---|---|---|---|---|---|---|---|---|---|
| WedOct 8 | 10:30am | USD | Crude Oil Inventories | 2.1M | -1.4M | ||||
| 1:01pm | USD | 10-y Bond Auction | 2.54|2.7 | ||||||
| 2:00pm | USD | FOMC Meeting Minutes |
This is not a solicitation of any order to buy or sell, but a current market view provided by Cannon Trading Inc. Any statement of facts here in contained are derived from sources believed to be reliable, but are not guaranteed as to accuracy, nor they purport to be complete. No responsibility is assumed with respect to any such statement or with respect to any expression of opinion herein contained. Readers are urged to exercise their own judgment in trading.
Hello Traders,
For 2014 I would like to wish all of you discipline and patience in your trading!
Time sure does tick a bit different in the commodities and futures world….
Some traders know time has passed quickly when it is time to change to the Dec. contract versus the Sept. contract, others may notice it when they think “wow, monthly unemployment is this Friday, time sure flies…” and still other traders, perhaps professionals and money managers notice it when one month ends and another starts and it is time to share monthly results with their clients…..
Either way you look at it, hope October will be a great trading month!
Today I noticed a couple of market behaviors I have noticed in the past and wanted to share with you.
The first is us Bonds trading behavior on the last trading day of the month on the last 15 minutes of the old pit session, i.e. 13:45 to 14:00 central time.
While I did not spend any time trying to predict the direction of the move, I seen it many times, the bonds will make a 10-15 ticks ( 15 tick in bonds = $500 per contract) move during the last 15 minutes as large traders position themselves ahead of months close.
Below is a 15 minute chart of Bonds from today….notice the very tight range all day long until the last 15 minutes….if you go back to the last trading day of the month, you will notice this pattern more often than not. Of course, I leave the important work to you…and that is which way and how can one try to take advantage of it….PS: My trade system below missed entering the short by 1 tick )-:
, Equalized Active 15Min Continuation")
Custom USA – 30Yr US Treasury Bonds (Globex), Equalized Active 15Min Continuation
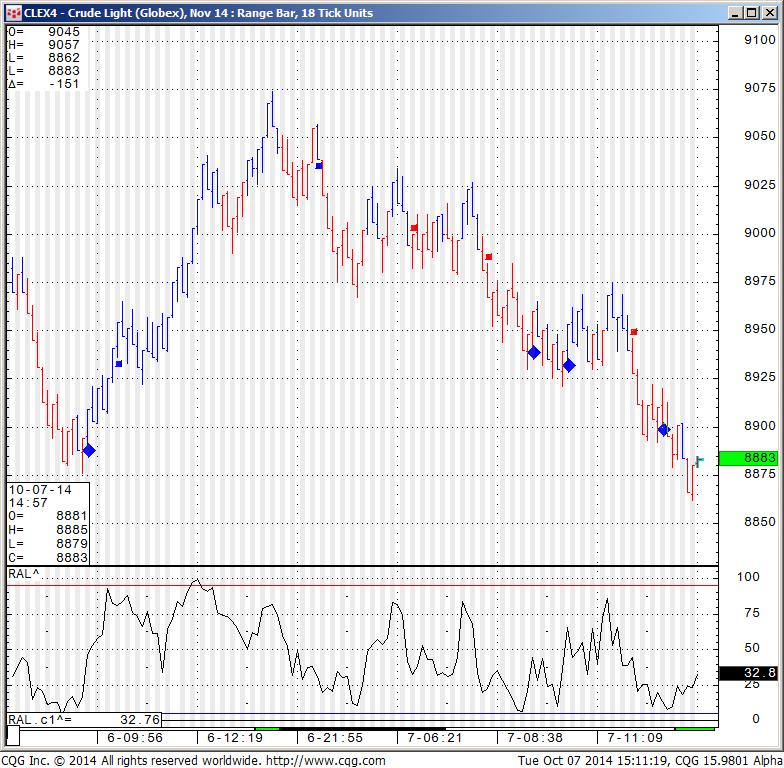
The second pattern for you to investigate if interested is the behavior of crude oil futures around “round numbers”. Today was obviously a HUGE move in crude ( down over $3 or $3000 per contract or 3.5%) but notice the 10 seconds chart I am sharing with ( yes, seconds, not minutes…) of what happened when crude broke below 93.00 and 92.00 today…..Once again, the million dollar question, how and can you take advantage of it? Obviously in this case it seems like there were MANY sell stops placed right below the round numbers which resulted in another accelerated move to the down side.
Crude breaking below $93.00
, Equalized Active Continuation, Primary Session, 10Sec")
CLE – Crude Light (Globex), Equalized Active Continuation, Primary Session, 10Sec
Crude breaking below $92.00
, Equalized Active Continuation, Primary Session, 10Sec")
CLE – Crude Light (Globex), Equalized Active Continuation, Primary Session, 10Sec
GOOD TRADING !
Trading Futures, Options on Futures, and retail off-exchange foreign currency transactions involves substantial risk of loss and is not suitable for all investors. You should carefully consider whether trading is suitable for you in light of your circumstances, knowledge, and financial resources. You may lose all or more of your initial investment. Opinions, market data, and recommendations are subject to change at any time. Past performance is not indicative to future results.
If you like Our Futures Trading Daily Support and Resistance Levels, Please share!
Futures Trading Levels
| Contract Dec. 2014 | SP500 | Nasdaq100 | Dow Jones | Mini Russell | Dollar Index |
| Resistance 3 | 1992.25 | 4104.58 | 17169 | 1133.17 | 87.09 |
| Resistance 2 | 1985.25 | 4084.67 | 17116 | 1125.43 | 86.71 |
| Resistance 1 | 1975.00 | 4064.08 | 17038 | 1110.97 | 86.37 |
| Pivot | 1968.00 | 4044.17 | 16985 | 1103.23 | 86.00 |
| Support 1 | 1957.75 | 4023.58 | 16907 | 1088.77 | 85.66 |
| Support 2 | 1950.75 | 4003.67 | 16854 | 1081.03 | 85.28 |
| Support 3 | 1940.50 | 3983.08 | 16776 | 1066.57 | 84.94 |
| Contract | December Gold | Dec.Silver | Nov. Crude Oil | Dec. Bonds | Dec. Euro |
| Resistance 3 | 1235.0 | 18.19 | 97.97 | 139 2/32 | 1.2837 |
| Resistance 2 | 1227.9 | 17.88 | 96.44 | 138 25/32 | 1.2773 |
| Resistance 1 | 1218.6 | 17.46 | 93.93 | 138 13/32 | 1.2705 |
| Pivot | 1211.5 | 17.16 | 92.40 | 138 4/32 | 1.2641 |
| Support 1 | 1202.2 | 16.74 | 89.89 | 137 24/32 | 1.2573 |
| Support 2 | 1195.1 | 16.43 | 88.36 | 137 15/32 | 1.2509 |
| Support 3 | 1185.8 | 16.01 | 85.85 | 137 3/32 | 1.2441 |
| Contract | Dec Corn | Dec. Wheat | Nov. Beans | Dec. SoyMeal | Dec. bean Oil |
| Resistance 3 | 329.2 | 490.0 | 944.17 | 311.30 | 33.25 |
| Resistance 2 | 327.1 | 484.3 | 937.08 | 308.30 | 33.02 |
| Resistance 1 | 323.9 | 481.0 | 925.17 | 303.60 | 32.70 |
| Pivot | 321.8 | 475.3 | 918.08 | 300.60 | 32.47 |
| Support 1 | 318.7 | 472.0 | 906.2 | 295.9 | 32.1 |
| Support 2 | 316.6 | 466.3 | 899.08 | 292.90 | 31.92 |
| Support 3 | 313.4 | 463.0 | 887.17 | 288.20 | 31.60 |
| Date | 10:18am | Currency | Impact | Detail | Actual | Forecast | Previous | Graph | |
|---|---|---|---|---|---|---|---|---|---|
| WedOct 1 | 3:15am | EUR | Spanish Manufacturing PMI | 52.6 | 52.3 | 52.8 | |||
| 3:45am | EUR | Italian Manufacturing PMI | 50.7 | 49.4 | 49.8 | ||||
| 4:00am | EUR | Final Manufacturing PMI | 50.3 | 50.5 | 50.5 | ||||
| 5:33am | EUR | German 10-y Bond Auction | 0.93|1.1 | 1.05|1.4 | |||||
| 8:15am | USD | ADP Non-Farm Employment Change | 213K | 207K | 202K | ||||
| 9:45am | USD | Final Manufacturing PMI | 57.5 | 58.0 | 57.9 | ||||
| 10:00am | USD | ISM Manufacturing PMI | 56.6 | 58.6 | 59.0 | ||||
| USD | Construction Spending m/m | -0.8% | 0.5% | 1.2% | |||||
| USD | ISM Manufacturing Prices | 59.5 | 56.8 | 58.0 | |||||
| 10:30am | USD | Crude Oil Inventories | 0.6M | -4.3M | |||||
| All Day | USD | Total Vehicle Sales | 16.9M | 17.5M |
This is not a solicitation of any order to buy or sell, but a current market view provided by Cannon Trading Inc. Any statement of facts here in contained are derived from sources believed to be reliable, but are not guaranteed as to accuracy, nor they purport to be complete. No responsibility is assumed with respect to any such statement or with respect to any expression of opinion herein contained. Readers are urged to exercise their own judgment in trading.
Hello Traders,
For 2014 I would like to wish all of you discipline and patience in your trading!
Volatility has picked up again! Make sure you adapt as markets are always changing and what may work for range bound/ low volatility days will not work for wide range/ higher volatility days.
I see major support for SP500 at 1795 and it will be interesting to see price reaction if we test this level in the next few days.
On a different note, I wrote a quick analysis along with chart for Crude Oil futures at:
http://experts.forexmagnates.com/crude-oil-attempting-break-lower/
GOOD TRADING !
Trading Futures, Options on Futures, and retail off-exchange foreign currency transactions involves substantial risk of loss and is not suitable for all investors. You should carefully consider whether trading is suitable for you in light of your circumstances, knowledge, and financial resources. You may lose all or more of your initial investment. Opinions, market data, and recommendations are subject to change at any time. Past performance is not indicative to future results.
If you like Our Futures Trading Daily Support and Resistance Levels, Please share!
Futures Trading Levels
| Contract Sept. 2014 | SP500 | Nasdaq100 | Dow Jones | Mini Russell | Dollar Index |
| Resistance 3 | 1954.92 | 3947.92 | 16680 | 1143.87 | 82.07 |
| Resistance 2 | 1944.08 | 3924.08 | 16590 | 1135.53 | 81.89 |
| Resistance 1 | 1929.17 | 3899.42 | 16479 | 1127.07 | 81.73 |
| Pivot | 1918.33 | 3875.58 | 16389 | 1118.73 | 81.55 |
| Support 1 | 1903.42 | 3850.92 | 16278 | 1110.27 | 81.40 |
| Support 2 | 1892.58 | 3827.08 | 16188 | 1101.93 | 81.22 |
| Support 3 | 1877.67 | 3802.42 | 16077 | 1093.47 | 81.06 |
| Contract | December Gold | Sept.Silver | Sept. Crude Oil | September Bonds | Sept. Euro |
| Resistance 3 | 1306.4 | 2065.0 | 100.18 | 139 19/32 | 1.3483 |
| Resistance 2 | 1300.7 | 2047.0 | 99.43 | 139 1/32 | 1.3455 |
| Resistance 1 | 1294.7 | 2012.0 | 98.51 | 138 21/32 | 1.3416 |
| Pivot | 1289.0 | 1994.0 | 97.76 | 138 3/32 | 1.3388 |
| Support 1 | 1283.0 | 1959.0 | 96.84 | 137 23/32 | 1.3349 |
| Support 2 | 1277.3 | 1941.0 | 96.09 | 137 5/32 | 1.3321 |
| Support 3 | 1271.3 | 1906.0 | 95.17 | 136 25/32 | 1.3282 |
| Contract | Dec Corn | Sept. Wheat | Nov. Beans | Dec. SoyMeal | Dec. bean Oil |
| Resistance 3 | 372.0 | 553.2 | 1074.75 | 352.27 | 36.01 |
| Resistance 2 | 369.8 | 552.8 | 1070.25 | 349.53 | 35.96 |
| Resistance 1 | 368.5 | 552.7 | 1068.00 | 346.57 | 35.91 |
| Pivot | 366.3 | 552.3 | 1063.50 | 343.83 | 35.86 |
| Support 1 | 365.0 | 552.2 | 1061.3 | 340.9 | 35.8 |
| Support 2 | 362.8 | 551.8 | 1056.75 | 338.13 | 35.76 |
| Support 3 | 361.5 | 551.7 | 1054.50 | 335.17 | 35.71 |
This is not a solicitation of any order to buy or sell, but a current market view provided by Cannon Trading Inc. Any statement of facts here in contained are derived from sources believed to be reliable, but are not guaranteed as to accuracy, nor they purport to be complete. No responsibility is assumed with respect to any such statement or with respect to any expression of opinion herein contained. Readers are urged to exercise their own judgment in trading.
Jump to a section in this post:
1. Market Commentary
2. Support and Resistance Levels – S&P, Nasdaq, Dow Jones, Russell 2000
3. Support and Resistance Levels – Gold, Euro, Crude Oil, T-Bonds
4. Daily Mini S&P Chart
5. Economic Reports for Wednesday November 2, 2011
DAYLIGHT SAVING ends this weekend!
International traders especially, please pay attention we are moving the clocks an hour back.
| Contract (Dec. 2011) | SP500 (big & Mini) |
Nasdaq100 (big & Mini) |
Dow Jones (big & Mini) |
Mini Russell |
| Resistance Level 3 | 1272.83 | 2398.00 | 12250 | 767.40 |
| Resistance Level 2 | 1262.17 | 2379.00 | 12129 | 758.50 |
| Resistance Level 1 | 1256.33 | 2365.00 | 12032 | 751.90 |
| Pivot Point | 1245.67 | 2346.00 | 11911 | 743.00 |
| Support Level 1 | 1239.83 | 2332.00 | 11814 | 736.40 |
| Support Level 2 | 1229.17 | 2313.00 | 11693 | 727.50 |
| Support Level 3 | 1223.33 | 2299.00 | 11596 | 720.90 |
| Contract | Dec. Gold | Dec. Euro | Nov. Crude Oil | Dec. Bonds |
| Resistance Level 3 | 1780.2 | 1.4034 | 97.35 | 143 20/32 |
| Resistance Level 2 | 1772.4 | 1.3957 | 96.14 | 142 18/32 |
| Resistance Level 1 | 1765.3 | 1.3863 | 95.29 | 141 25/32 |
| Pivot Point | 1757.5 | 1.3786 | 94.08 | 140 23/32 |
| Support Level 1 | 1750.4 | 1.3692 | 93.23 | 139 30/32 |
| Support Level 2 | 1742.6 | 1.3615 | 92.02 | 138 28/32 |
| Support Level 3 | 1735.5 | 1.3521 | 91.17 | 138 3/32 |
On a different note please see weekly chart of the SP500 for your review below, which also brings me to a quick tip on how I try to manage trading multiple time frames.
There are times that I will have trades that I consider swing trades or longer term trades while I still look for intra day or day trade opportunities. When that happens I will try to use different contracts. Example, lets say I think that there is a set up based on the daily chart for short position on stock indices, I may go short mini Dow but then there might be a daytrade set up for different directions in which I will use the mini SP in order not to confuse myself between my longer term set ups and my intraday set ups.
Have a great weekend!!

Sentix Investor Confidence
5:30am
Retail Sales m/m
6:00am
German Industrial Production m/m
7:00am
Consumer Credit m/m
4:00pm
Cannon Trading / E-Futures.com
There is a good article available at the Cannon Trading Company Weekly Newsletter.
GOOD TRADING!

Building Permits
8:30am USD
Unemployment Claims
8:30am USD
Current Account
8:30am USD
Housing Starts
8:30am USD
Philly Fed Manufacturing Index
10:00am USD
Natural Gas Storage
10:30am USD
Economics Report Source: http://www.forexfactory.com/calendar.php

This is not a solicitation of any order to buy or sell, but a current market view provided by Cannon Trading Inc. Any statement of facts herein contained are derived from sources believed to be reliable, but are not guaranteed as to accuracy, nor they purport to be complete. No responsibility is assumed with respect to any such statement or with respect to any expression of opinion herein contained. Readers are urged to exercise their own judgment in trading!
Not an easy market to read right now in my opinion.
It is showing signs like it would like to visit some lower levels, yet there is enough buying interest to keep it above 1127.
This Friday monthly unemployment levels will be watched closely.
If the market breaks below 1127, it has a chance of picking some more speed to the downside.
On the flip side, bulls will need to see new highs in order to get back in control of price action.
Daily chart with some price levels to watch for your review below:

Commodity Futures Trading Charts
GOOD TRADING!

Futures Trading Levels
This Week’s Calendar from Econoday.Com
All reports are EST time
Another great source for economic reports around the globe with “report importance indicator” at: http://www.forexfactory.com/calendar.php
Tuesday, October 5th 2010 – http://mam.econoday.com/byweek.asp?cust=mam
Disclaimer:
Trading commodity futures and options involves substantial risk of loss. The recommendations contained in this letter is of opinion only and does not guarantee any profits. These are risky markets and only risk capital should be used. Past performances are not necessarily indicative of future results. This is not a solicitation of any order to buy or sell, but a current futures market view provided by Cannon Trading Inc. Any statement of facts herein contained are derived from sources believed to be reliable, but are not guaranteed as to accuracy, nor they purport to be complete. No responsibility is assumed with respect to any such statement or with respect to any expression of opinion herein contained. Readers are urged to exercise their own judgment in trading!


 1-800-454-9572
 Contact Us

