Weekly Newsletters, Futures Trading Tips & Insight, Commodity Trading Educational Resources & Much More.
Hello Traders,
For 2014 I would like to wish all of you discipline and patience in your trading!
Another two markets I like to touch on when it comes to “other markets to daytrade beside the mini SP 500” are Crude Oil Futures and Gold futures.
More than a few similarities between the two markets.
They are both volatile, can move VERY fast. I have seen some very large moves happen in matter of minutes if not seconds. The “fear & greed” factor really plays a role in these specific two markets.
Both have active trading hours starting with Far East trading around 10 PM est all the way to the next morning until about 3 PM est. Good volume generally speaking but not close to the mini SP or ten year notes. So you may see some slippage on stops but the volume is more than enough to trade size.
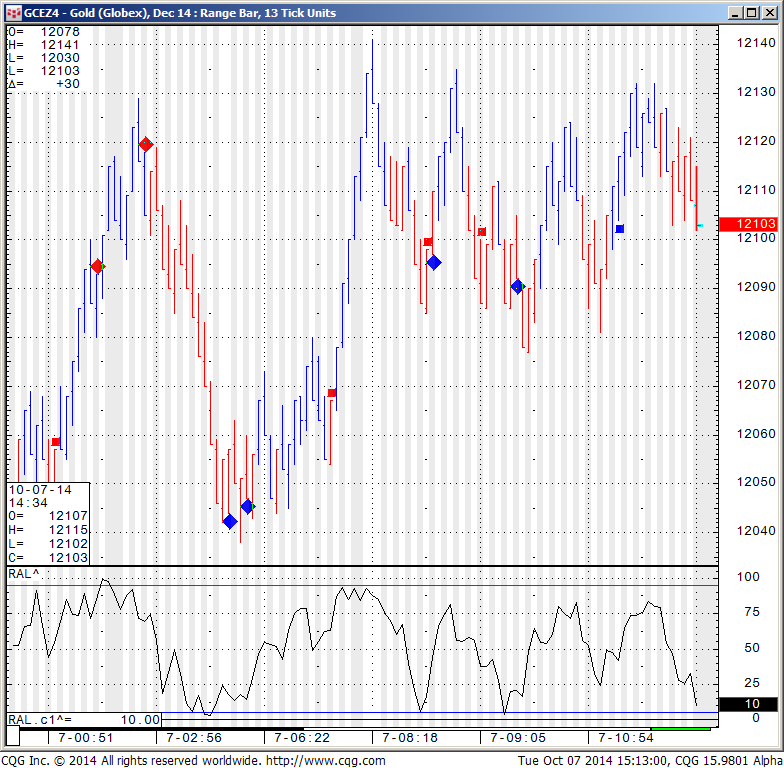
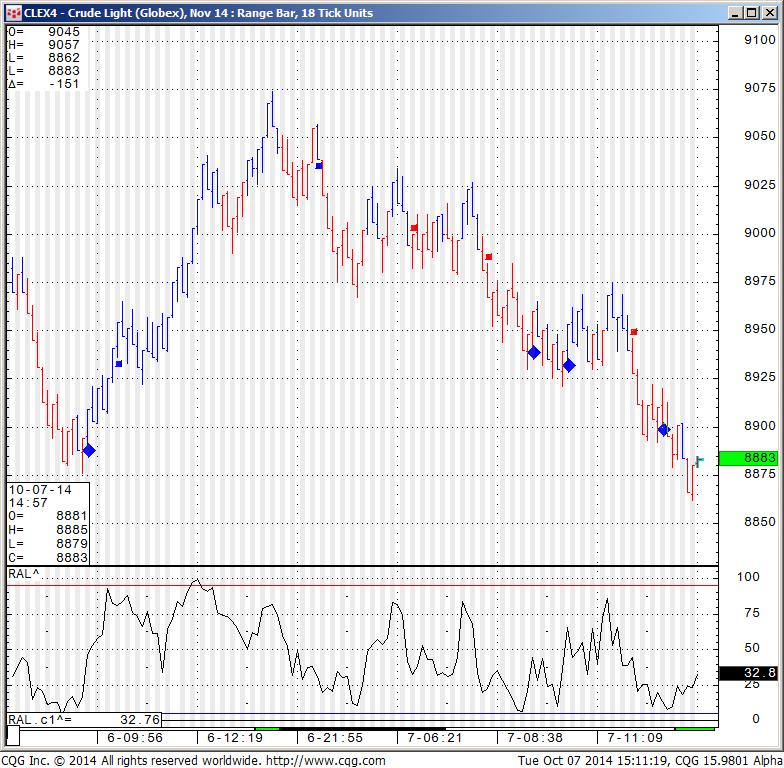
Each tick on gold is $10, so every dollar move =$100 against you or in your favor. Crude is similar, each tick = $10. One full $1 move = $1000.
Both markets “traded what I consider average behavior” , the range on gold was $11 or = $1100 wide using one futures contract. Crude ranges today was less than $1.95 or about $1950 between hi/lo.
I like using overbought/ oversold indicators on the two markets as well as using range / Renko charts.
If you never traded these markets before, I highly recommend exploring in simulation/ demo mode. get a feel for the explosiveness, volatility, personality for a few weeks before trying in live mode.
As always, any questions, please feel free to email me.
Two charts from today’s session of gold and crude for your review below:
If you like Our Futures Trading Daily Support and Resistance Levels, Please share!
Futures Trading Levels
| Contract Dec. 2014 | SP500 | Nasdaq100 | Dow Jones | Mini Russell | Dollar Index |
| Resistance 3 | 1977.25 | 4052.25 | 17094 | 1103.50 | 86.70 |
| Resistance 2 | 1966.75 | 4031.25 | 16999 | 1096.90 | 86.46 |
| Resistance 1 | 1946.75 | 3992.25 | 16818 | 1084.50 | 86.12 |
| Pivot | 1936.25 | 3971.25 | 16723 | 1077.90 | 85.88 |
| Support 1 | 1916.25 | 3932.25 | 16542 | 1065.50 | 85.54 |
| Support 2 | 1905.75 | 3911.25 | 16447 | 1058.90 | 85.30 |
| Support 3 | 1885.75 | 3872.25 | 16266 | 1046.50 | 84.96 |
| Contract | December Gold | Dec.Silver | Nov. Crude Oil | Dec. Bonds | Dec. Euro |
| Resistance 3 | 1226.7 | 18.06 | 92.00 | 142 11/32 | 1.2805 |
| Resistance 2 | 1220.4 | 17.84 | 91.29 | 141 17/32 | 1.2747 |
| Resistance 1 | 1215.6 | 17.52 | 90.05 | 141 3/32 | 1.2707 |
| Pivot | 1209.3 | 17.30 | 89.34 | 140 9/32 | 1.2649 |
| Support 1 | 1204.5 | 16.98 | 88.10 | 139 27/32 | 1.2609 |
| Support 2 | 1198.2 | 16.76 | 87.39 | 139 1/32 | 1.2551 |
| Support 3 | 1193.4 | 16.44 | 86.15 | 138 19/32 | 1.2511 |
| Contract | Dec Corn | Dec. Wheat | Nov. Beans | Dec. SoyMeal | Dec. bean Oil |
| Resistance 3 | 352.3 | 506.7 | 973.00 | 327.87 | 33.86 |
| Resistance 2 | 346.7 | 506.6 | 963.75 | 322.33 | 33.69 |
| Resistance 1 | 343.6 | 506.4 | 952.25 | 317.77 | 33.40 |
| Pivot | 337.9 | 506.3 | 943.00 | 312.23 | 33.23 |
| Support 1 | 334.8 | 506.2 | 931.5 | 307.7 | 32.9 |
| Support 2 | 329.2 | 506.1 | 922.25 | 302.13 | 32.77 |
| Support 3 | 326.1 | 505.9 | 910.75 | 297.57 | 32.48 |
| Date | 4:08pm | Currency | Impact | Detail | Actual | Forecast | Previous | Graph | |
|---|---|---|---|---|---|---|---|---|---|
| WedOct 8 | 10:30am | USD | Crude Oil Inventories | 2.1M | -1.4M | ||||
| 1:01pm | USD | 10-y Bond Auction | 2.54|2.7 | ||||||
| 2:00pm | USD | FOMC Meeting Minutes |
This is not a solicitation of any order to buy or sell, but a current market view provided by Cannon Trading Inc. Any statement of facts here in contained are derived from sources believed to be reliable, but are not guaranteed as to accuracy, nor they purport to be complete. No responsibility is assumed with respect to any such statement or with respect to any expression of opinion herein contained. Readers are urged to exercise their own judgment in trading.


 1-800-454-9572
 Contact Us