The line the market spent last week running away from has arrived, and it arrived on the morning the contract underneath it changes
- The regime line collapsed onto the marketThe flip closed at 7,665.01 against 7,786.37 the session before. That is a 121-point drop in one day, and it leaves the single most consequential level on the board close enough to Friday’s close that a normal fifteen-minute range covers it. Section 04.
- The whole corridor lifted a hundred pointsPut wall from 7,500 to 7,600, call wall from 7,600 back to 7,700, max pain at 7,675. The floor moved as far as the ceiling did, and the cash index closed 56.98 above the floor and 43.02 below the roof — almost exactly in the middle of the band for the first time in a week. Roughly 101,500 contracts sit on the 7,700 strike alone. Section 04.
- Rollover week, and the levels are on the wrong contractCannon’s notice has clients trading December (Z26) from this morning; September’s last trading day is Friday. Open interest has already gone — 585,569 contracts in December — while overnight volume was still heavier in September. December trades 67.25 points above it, so every futures level carried over from last week, including Cannon’s own pivot table, needs converting before the open. Section 04 does the conversion.
- Eighty-six and a half, and the strip wants more than oneCME FedWatch has Wednesday at 86.5% hike / 13.5% hold and zero easing at any horizon. Behind it the December fed funds contract implies an average effective rate of 4.08% against roughly 3.63% today, and March 2027 implies 4.29%. That is not one move priced. Section 09.
- Two overnight shocks, pointing opposite waysThe AI-safety argument that began with Anthropic safety researcher Jacob Coxon’s resignation on 9 September has reached the listings pipeline, and the Nasdaq contract is down 1.24% against the S&P’s 0.45%, with Korea’s Kospi off 2.51%. Meanwhile the Saudi East-West pipeline is shut and today’s Iran–Gulf talks in Oman were postponed on Sunday, putting WTI up 3.13% at $103.18. Growth-negative and inflation-positive in the same night, two days before the decision.
What changes it: nothing on the US calendar. There is no top-tier data today, no Fed speaker — blackout runs through Thursday — and no earnings of consequence until after the bell. That is the whole point: between now and Wednesday at two o’clock the tape has only headlines and positioning to trade, and the two headline generators are the Strait of Hormuz and the AI-safety story. A market sitting eight points under its regime line with nothing scheduled to resolve it is a market that will be pushed around by whoever shows up.
A green Friday, a red Sunday night, and a rollover that moves the reference point sixty-seven points before anyone trades
| Instrument | Last | Change | Note |
|---|---|---|---|
| ES Dec overnight · new front month · prior settle 7,727.25 | 7,692.50 | −0.45% | The contract to be in from this morning. Against Friday’s cash close the December basis is +70.27, so the overnight print implies a cash-equivalent 7,622.23 — 34.75 under Friday and 43 under the flip. Overnight range 7,672.50–7,701.25 |
| ES Sep expiring Friday · settle 7,659.50 | 7,625.25 | −0.45% | The old front month, and the one Cannon’s pivot table is still calculated on. The Dec–Sep spread is +67.25. Open interest has already migrated: 585,569 contracts in December |
| NQ Dec / YM Dec / RTY Dec overnight | 29,316.25 / 52,973 / 2,922.40 | −1.24% / −0.05% / −0.12% | The Nasdaq contract is carrying the AI-safety story almost alone. The Dow contract is effectively unchanged and the Russell is barely lower. This is a single-theme selloff, not a risk-off session — and it is the same theme Asia traded, with the Kospi down 2.51% and the Nikkei off about 1% |
| S&P 500 / Nasdaq Comp / Dow / Russell cash, Fri close | 7,656.98 / 26,333.04 / 52,573.29 / 2,903.94 | +0.86% / +0.96% / +0.98% / +0.45% | All four higher on a session when core CPI printed hot. The index still finished the week lower and sits 2.04% below the 13 August record of 7,816.70. Nine of eleven sectors were red on the week; only energy and communication services held green |
| WTI Oct / Brent Nov overnight · Fri settles 100.05 / 104.61 | 103.18 / 107.83 | +3.13% / +3.08% | Crude fell 3.36% on Friday and has taken all of it back and more overnight. The driver is physical: Saudi Arabia shut the East-West pipeline — its principal route around Hormuz — after Thursday and Friday’s drone strikes, and the Iran–Gulf corridor talks scheduled for Salalah today were postponed on Sunday |
| ULSD Oct / RBOB Nov / Nat gas Nov overnight | 5.1012 / 3.1845 / 3.030 | +2.86% / +2.07% / +1.58% | Diesel is outrunning the barrel again on a percentage basis, and it has been doing so for a fortnight. This is the row that matters most for the inflation print two days from now, and Section 10 takes it apart |
| Gold Dec / Silver Dec / Copper Dec overnight · Fri settles 4,408.90 / 65.19 / 6.55 | 4,376.5 / 64.580 / 6.4880 | −0.73% / −0.93% / −0.92% | The entire metals complex is lower on a night the Middle East escalated. Gold falling into a war headline is the clearest single expression of what the market thinks Wednesday holds: this is a hawkish tape, and hawkish beats haven |
| US 2Y / 10Y / 30Y Fri close · futures flat overnight | 4.63% / 4.97% / 5.36% | 2s10s +35bp | The December ten-year note is unchanged overnight at 106-035 and the bond is seven ticks lower. The curve has bear-flattened all month — the two-year up roughly 45bp against the ten-year’s 25bp — which is the signature of hike pricing rather than growth pricing |
| DXY Dec / EUR Dec / Bitcoin overnight | 99.025 / 1.16150 / 77,800 | +0.19% / −0.20% / +0.48% | The dollar is firm into the meeting and the euro is offered. Bitcoin is holding a 77 handle but has not participated in anything for a fortnight — the crypto beta is behaving like a bond, not like the Nasdaq |
| VIX cash, Fri close · Oct future 18.75 | 15.84 | −11.21% | Spot volatility fell eleven per cent on the Friday before a Federal Reserve meeting that is 86.5% priced to deliver the first hike of a cycle. The October future sits 2.91 points above spot. Section 10 |
| Gauge | Reading | Read |
|---|---|---|
| Dealer regime Fri close, all expiries | Short gamma | Below the flip, but by 8.03 points against 194.67 a session earlier. The thinnest short-gamma reading of the run, and the first that a single morning could erase. Section 04 |
| CNN Fear & Greed Fri evening | 33 · Fear | Unchanged from Thursday, against 45 a week ago and 60 a month ago. Market momentum is the sub-indicator flagging Fear. The gauge has halved in four weeks on an index that is down two per cent from its high |
| AAII bull / bear w/e Sep 9 | 38.0% / 39.3% | Spread −1.3. Neutral at 22.7% is well below its long-run average — the middle of the survey has emptied out into the bear column rather than the bull column |
| Cboe equity put/call Fri close | 0.58 | Call-heavy, and printed underneath a Fear reading and a negative AAII spread for a second week. What people say and what they buy are still pointing in opposite directions |
| VIX complex Fri closes | VIX9D 14.47 · VIX 15.84 · VIX3M 18.60 | Steep contango with the nine-day nearly a point and a half under spot. The curve is not pricing an event this week; it is pricing an event some time after it |
| Index implied vol SPX, Fri close | 12.81% IV · 10.37% HV | IV rank 13.71%, IV percentile 24%. Implied volatility on the S&P is in the bottom seventh of its own year, two sessions before a Federal Reserve decision |
| Positioning latest available | 100th pct | Volatility-control equity allocation at the top of its own history, and speculators short 94,829 VIX futures net, an increase of 10,758 on the week. The community that has to buy volatility when volatility rises is the community that has sold the most of it |
| CME FedWatch Sep 16 meeting | 86.5% hike | 13.5% hold, 0.0% ease, against a 3.50–3.75% target. It was roughly 66% two weeks ago and near 30% before Jackson Hole. Section 09 |
The flow read has not changed shape in a week, and that is the problem. Bank of America’s systematic ledger still carries roughly $9 billion of incremental buying capacity against as much as $163 billion of forced selling on a decline — eighteen to one — with volatility-control allocation at the 100th percentile. Fund flows have already turned. Friday’s Flow Show, from Bank of America’s Jared Woodard and Michael Hartnett, has US equity funds shedding $14.2 billion over three weeks — the largest three-week outflow since January — with global stock fund inflows slowing to roughly $7 billion a week from $52 billion a week as recently as July, while investment-grade bond funds took a 23rd consecutive weekly inflow and government funds an 11th. Their verdict on the setup: “Blasé markets and bravado policy are a recipe for volatility.” And the corporate bid is going away on a published schedule. Citadel Securities’ Scott Rubner date-stamped the buyback blackout as beginning to accelerate around 12 September and put roughly $6.2 trillion of US options notional — about 23% of total US options exposure — expiring on 18 September, which would challenge June’s record. A market with no mechanical buyer, a loaded mechanical seller, and its largest expiry of the quarter four sessions away is not a market that gets to be calm by default.
Nothing today, everything Wednesday, and a week that ends on the largest risk-transfer day of the quarter
| When | Event | Reference | Why it matters |
|---|---|---|---|
| Mon | Equity index rollover · 3- and 6-month bills | Sep → Dec (Z26) | Cannon’s rollover notice has clients in ES, MES, NQ, MNQ, YM, MYM and RTY December from this morning. September’s last trading day is Friday. Liquidity finishes migrating over the next two sessions, which means it is split across two contracts exactly as the Fed decides |
| Tue 08:30 | Empire State manufacturing · FOMC day one | Sep | A second-tier regional survey and nothing else. The two-day meeting begins with no data of consequence to inform it |
| Wed 08:30 | August retail sales | — | Lands five and a half hours before the decision, and it is the only hard read on the consumer the committee will see between now and the vote. With retail petrol at $4.30 a gallon and diesel at a record, the split between the nominal and the real number is the whole content of this release |
| Wed 14:00 | FOMC decision + SEP / dot plot · Warsh presser 14:30 | hike to 3.75–4.00% priced | Chair Warsh’s first move if he makes one, with a fresh dot plot attached. The dots matter more than the decision: 86.5% of the strip already owns the hike and none of it owns the path. Section 09 |
| Wed AMC | Lennar Q3 · UK CPI overnight | $1.30 e on $8.4B | Consensus is a 35% year-on-year earnings decline on a 4.5% revenue drop, printing six hours after a rate decision, with the thirty-year mortgage above seven per cent. The cleanest listed read on what this rate structure is doing to the household |
| Thu | Claims · Philly Fed · housing starts · Bank of England | Eurozone CPI | The morning after. Three US releases at 8:30 into a market that will still be digesting the dots, and the first of two foreign central banks |
| Fri | Bank of Japan · Japan CPI · industrial production 09:15 · Bowman 09:30 | — | The first Fed voice out of blackout is Vice Chair for Supervision Michelle Bowman, in London at 9:30, and the listed topic is stress testing rather than the outlook. She has a vote, so treat any policy remark as unscheduled rather than expected |
| Fri | Quarterly triple witching · S&P index rebalance · Sep contract expiry | ~$6.2tn notional | Roughly 23% of total US options exposure rolls off on one session, tracking to challenge June’s record. It is also the last trading day of the September future and the index rebalance. Three separate mechanical events on the same Friday |
Everything moved up a hundred points, the market closed in the middle of it, and the contract underneath all of it changes this morning
Take the rollover first, because it governs how every other number on this page is used. Cannon’s own notice has clients in December (ESZ26) from this morning; September’s last trading day is Friday, the same session as quarterly expiry. Open interest has already moved — 585,569 contracts in December — while the overnight session still printed more volume in September, which is what a roll in progress looks like. December is trading 67.25 points above September, and its basis to Friday’s cash close is +70.27. Cannon’s daily pivot table, published last night, is still calculated on the September contract — which is correct for the contract it names and wrong for the screen most people will be looking at by lunchtime. Every conversion below is spelled out so neither version can be misread.
Now the option book, where the movement was. The gamma flip closed at 7,665.01 against 7,786.37 on Thursday — a 121.36-point fall on a session the index rose 65.28. The distance from cash to the regime line went from 194.67 points to 8.03 in one day. Underneath it the corridor lifted as a block: the put wall rose a hundred points from 7,500 to 7,600, and the call wall went back up from 7,600 to 7,700. Friday’s close at 7,656.98 sits 56.98 above the floor and 43.02 below the roof. For the first time in a week the index is not standing on one of its own walls.
| Level | SPX | ES Dec · +70.27 | Role in today’s tape |
|---|---|---|---|
| Call wall all expiries | 7,700.00 | 7,770.27 | Back up a hundred points from Friday’s reading. It sits 43.02 above the cash close and 4.60 above Cannon’s R1 converted to cash — the tightest agreement between the pivot table and the option book anywhere on this page |
| Max pain Sep 14 expiry, 0DTE | 7,675.00 | 7,745.27 | Today’s own expiry pins 18.02 above Friday’s close and ten points above the flip. The pull is on the far side of the regime line, so getting to the pin means changing the regime on the way |
| Gamma flip regime line | 7,665.01 | 7,735.28 | Down 121.36 points in one session. Cash closed 8.03 underneath, the thinnest reading of this run. Above it dealers damp and the tape pins; below it they amplify and the tape trends. Overnight futures imply roughly 43 points below |
| Put wall all expiries | 7,600.00 | 7,670.27 | Up a hundred points, the first move in the floor in five sessions. It sits 6.15 under Cannon’s September S1 converted to cash and 22 points under the implied open — the first real structure the tape meets if the overnight offer holds. The quarterly’s own heaviest put sits a hundred points lower still |
One thing about that table is worth saying out loud: a hundred-point rise in the put wall on a 0.86% up-day is a bigger statement than the rally was. The heaviest put open interest on the board relocated upward with the market rather than staying behind it, which is what happens when downside protection is bought at higher strikes rather than rolled down.
Go underneath the aggregate and into the September quarterly — the 18 September expiry, four sessions away and by far the largest on the board — and the ceiling gets a much harder confirmation than the aggregate can give it. The quarterly’s heaviest call open interest above the market sits at 7,700 with 50,303 contracts, the same strike the all-expiry map names, arrived at from one expiration rather than four. What the aggregate cannot show is that 7,700 is carrying 51,214 puts as well. Call and put open interest together put roughly 101,500 contracts on a single strike 43.02 points above Friday’s close — the largest concentration anywhere in the book, and the market is sitting just underneath it. Behind it the upside thins in an orderly way: 7,800 carries 45,116 calls, 7,750 carries 31,092, and by 7,850 the call side is down to 10,983 and effectively finished. The ceiling is measured, not assumed.
The floor is the more interesting half, because the quarterly and the aggregate do not agree and the disagreement is worth money. The all-expiry map names 7,600 as the put wall, and the quarterly does carry 55,902 puts there. But the quarterly’s heaviest put below the market is not 7,600 — it is 7,500, with 82,575 contracts, roughly 27,000 more than the published wall and a hundred points lower. Between them, 7,550 carries 50,778 and 7,450 carries 50,474. That is four heavy strikes stacked inside two hundred points rather than one line in the sand. The aggregate is not wrong — it weights by gamma, and 7,600 sits closer to spot, so it earns the label. But a trader reading 7,600 as the floor and nothing underneath it has the shape of the downside backwards: the wall is at 7,600 and the mountain is at 7,500. One further qualification, and it cuts the other way from Friday’s: open interest has died out cleanly at the top of the book but not at the bottom — 7,450 is still carrying fifty thousand contracts on each side at the lower boundary of what can be measured, so treat anything beneath the mid-7,440s as a shelf rather than a level.
Today’s own expiry disagrees with all of it, and that is the most useful thing on this page. The Monday weekly on the September future has its heaviest call open interest above the market at 7,750 in futures terms with 4,224 contracts, and between 7,625 and 7,745 there is not a single strike carrying more than 1,341. Its heaviest put below the market sits at 7,570 in futures with 5,088. Convert those and the same-day book has no meaningful structure anywhere inside the hundred-point corridor the quarterly has drawn. Today’s expiry is not going to pin this tape — there is nothing in it to pin against. Friday’s will, and Friday is also the roll and the rebalance.
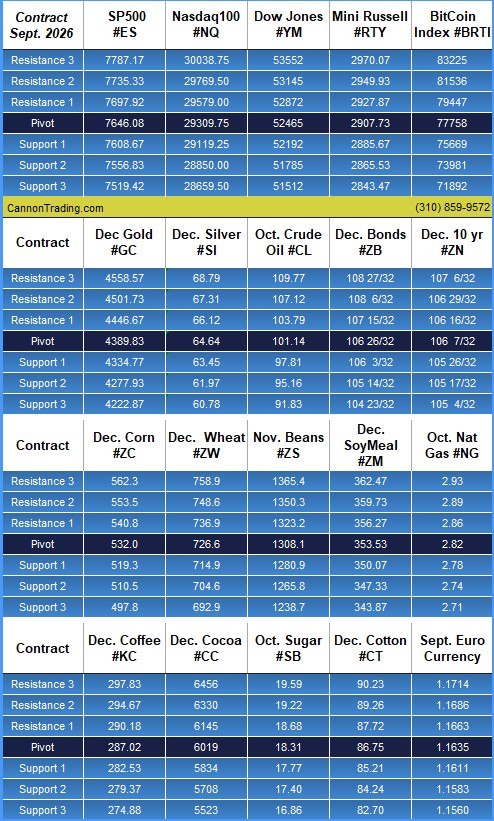
Cannon’s September E-mini pivot is 7,646.08, which converts to 7,643.56 on cash at Friday’s settle basis. That is 13.42 points below Friday’s close and 21.45 below the gamma flip — so the pivot sits inside the gap between the market and the regime line, and the overnight print of 7,625.25 in September is 20.83 points beneath it. Futures are opening the week on the wrong side of the pivot for the first time since Wednesday.
Above, R1 at 7,697.92 converts to 7,695.40, which is 4.60 points under the all-expiry call wall — a pivot formula and an option book, nothing in common, four and a half points apart. R2 at 7,735.33 converts to 7,732.81, and R3 at 7,787.17 converts to 7,784.65, which is thirty-two points under the August record. Below, S1 at 7,608.67 converts to 7,606.15 and lands six points over the put wall; S2 at 7,556.83 converts to 7,554.31, in the empty stretch beneath it; S3 at 7,519.42 converts to 7,516.90, which is roughly where Paul Ciana’s 7,500 breakout line sits. The pivot table and the option book bracket the same corridor from both ends and then agree on where the floor of a bad week would be.
Elsewhere on the board, and these matter more than the equity levels today: October crude pivots at 101.14 with R1 at 103.79 and R2 at 107.12 — the overnight print of 103.18 is already through the pivot and pressing R1. December gold pivots at 4,389.83 and the overnight 4,376.5 is beneath it; December silver at 64.64 against 64.58. The December ten-year note pivots at 106 7/32 against an overnight 106 3.5/32, and the bond at 106 26/32 against 106 17/32 — both rate contracts are opening the week under their pivots, which is the same message the equity map is sending from the other direction.
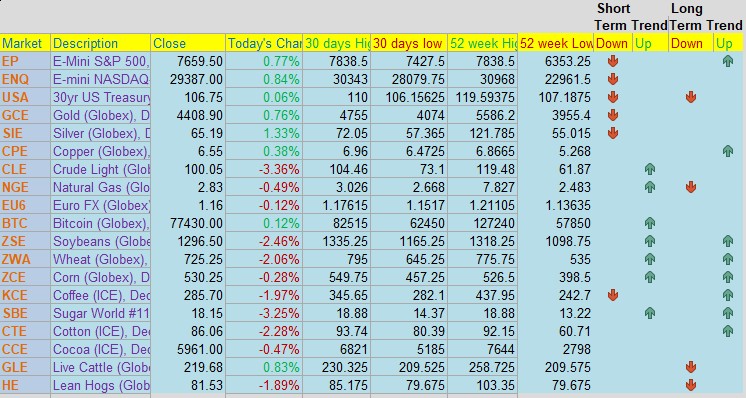
The Cannon Edge trend board has not forgiven Friday’s rally. The E-mini S&P row still carries a short-term down arrow against a long-term up arrow, unchanged from Thursday despite a 0.77% gain on the CQG settle, and the Nasdaq row carries a short-term down arrow with no long-term signal at all. Gold and silver both carry short-term down arrows after a session in which both rose. The thirty-year bond is down on both horizons. On the other side, crude carries a short-term up arrow and copper carries up arrows on both. An engine that refuses to upgrade the equity index on a green day while confirming the energy complex on a red one is describing the same tape as the option map: this is a market whose direction is being set somewhere other than in equities.
The Street’s most durable bull cut his own odds without cutting his number, and two desks softened targets they set in the spring
The most instructive change on the board this weekend, because the headline number did not move and everything underneath it did. Yardeni keeps his year-end S&P target at 8,400. But he cut the probability he assigns to his own “Roaring 2020s” scenario from 80% to 70% and raised the bear case from 20% to 30% — the first reduction in that ratio this year. To hold the target after that, he had to re-cut the arithmetic: 2027 earnings per share go up to $425 from $415, and the forward price-to-earnings multiple he is willing to pay comes down to 19.7 from 20.2. He cites oil above $100, a ten-year “nearly 5.00%” and a TIPS real yield of 2.60%.
Strip the framing away and the most-bullish independent on Wall Street is now paying for his target entirely with earnings and nothing with multiple. The supporting numbers are genuinely strong — forward earnings at a record $403.44, a record 16.8% forward profit margin — but he flags one of them as a warning rather than a support: analysts’ long-term earnings growth expectation is at 26.7%, an all-time high he calls collective exuberance. He also notes the equal-weight index is 3.5% off its high against 2.04% for the cap-weight, and says a sharp drop in bull-bear ratios this month would be a buying signal. The AAII spread went negative last week.
The most quantitatively specific thing anyone said on the tape last week, and it arrived on the day JPMorgan’s own chief economist moved his hike call forward to September. Lakos-Bujas is not troubled by it: “for as long as it’s a shallow hiking cycle, I think it’s something that the market should be able to absorb.” Asked whether the market could withstand two or three, he said yes — “mainly because fundamental backdrop is very strong,” adding that his bullishness on equity fundamentals over the past three to six months “if anything, has gotten higher, not lower.”
The number to write down is his yield tolerance. On roughly 20% projected 2027 earnings growth, he thinks equities can absorb a ten-year Treasury “up to about 6%” — and that “above that level is where you could start to see equity risk premium expansion and multiple compression.” The ten-year closed Friday at 4.97%. That is a published, falsifiable line more than a hundred basis points above where the argument about five per cent is currently being had, from the desk with the best view of cross-asset flow on the Street.
His answer on the other branch is the one that should unsettle anyone hoping for a hold: “I think you get a lot of volatility and violent internal rotations. Immediate reaction, maybe risk assets rip. But then subsequently, because the back end in rates starts to sell off, you could basically see the market sort of puke it out. Debasement trade I think goes on fire.” On positioning he reads the market as broadly neutral rather than short, with negative sentiment on top — a setup he calls “quite okay” if the fundamentals hold. He prefers large over small, and he is a buyer of a dip.
Chronert did in public what most desks do quietly: he told clients his own target looks too high. Citi’s year-end 8,100 now “looks on the aggressive side given the macro twist of higher oil since early August and mid-long end rates over the past several weeks.” He is not cutting it; he is saying it depends on a year-end rally once the uncertainties clear, and that third-quarter earnings should be fine in the meantime.
The level he names is the useful part. Chronert puts the ten-year at 4.80%, then 5.00%, as “a line in the sand” for tactical disruption, and says the risk is sharpest with oil above $80. Both conditions are already met: the ten-year closed Friday at 4.97% and WTI is at $103. On the Fed he splits from his own house economists — a hike is “not a foregone conclusion” because the backdrop lacks classic overheating signs — but adds that if the committee moves, investors should expect two, not one, and frames that as a positive for equities if it contains the long end. A within-house disagreement between the equity strategist and the economics team, on the one question that decides the week, is worth more than either view alone.
Wilson put a clock on it. “I do think in the next 30 days, if oil goes to $120, $130, $140, that’s a drain on liquidity” — and that is the condition under which he expects an S&P correction. He adds that heavy corporate fundraising is stretching investor capacity to absorb it. WTI has gone from $57.42 to above $102 this year, so the trigger he names is a further twenty per cent from here rather than a doubling.
What keeps this from being a bear call is the second half, which most of the wire coverage cut. “But it’s a correction. It’s not the end of the world… We’re rotating as opposed to reducing our overall equity exposure. I don’t think people should be reducing their equity exposure.” His standing year-end target remains 8,000, with a retest toward 7,000 inside the base case, and he wants to use weakness to add high-quality free-cash-flow compounders. A thirty-day correction warning from a strategist who is not selling is a statement about sequencing, not about direction.
Slok now explicitly expects the committee to raise rates, having not been in that camp a month ago. The trigger he cites is ISM services prices-paid running at 2021–22 levels, a series he argues leads consumer prices by roughly six months.
The more valuable piece is his framing of the yield move as structural rather than cyclical: “from a savings glut to a savings shortage.” Capital now competes for projects instead of projects competing for capital, so the clearing yield is simply higher. His evidence is specific and checkable — hyperscaler long-dated bond spreads have widened, and most paper issued in 2026 trades wider than where it priced. Because data centres, power, transmission and deficits are all long-duration claims, the repricing concentrates at the long end, which is his explanation for why thirty-year yields have moved further than two-year yields this year even as the curve bear-flattens on Fed pricing. If he is right, no Fed decision on Wednesday fixes the part of the curve that is actually hurting equities.
The cleanest opposition on the board, and it is an argument about instruments rather than about forecasts. El-Erian says the market-implied odds are too high and that he would vote against, on anchored breakevens and artificial-intelligence-driven supply-side gains. His formulation is the one to carry into Wednesday: a rate rise “cannot repel a tariff, cannot pump more crude out of the ground.” Raising into a supply shock damages the parts of the economy that are working without touching the part that is broken.
One technician and one level, and the level is not where it was. Fundstrat’s Mark Newton has the week just ended at S&P −0.8% with nine of eleven sectors red, energy and communication services the only green, and stays overweight energy on a clean breakout and overweight technology. His buyable-dip zone in the mid-7,550s did not trade last week. BTIG’s Jonathan Krinsky has published no fresh level, but his standing observation is worth carrying: since 1990 the equal-weight S&P has seen a drawdown of seven per cent or more between August and October in every midterm year but one.
Two targets softened, one economist flipped hawkish, and three standing calls the strip has now left behind
| Voice | Was | Now | What moved |
|---|---|---|---|
| Ed YardeniYardeni Research | 80% bull case · 20.2x forward | 70% · 19.7x | Target held at 8,400, but the bull-case probability cut ten points and the multiple cut half a turn, paid for with a $10 upgrade to 2027 earnings. The first time this year he has raised his own bear-case odds |
| Scott ChronertCiti | 8,100 year-end | 8,100 “on the aggressive side” | Blames oil since early August and the mid-to-long end, not earnings. Names 4.80% then 5.00% on the ten-year as the line in the sand, particularly with crude above $80. Both conditions already met |
| Torsten SlokApollo | No September move | Expects a hike | Flipped on ISM services prices paid at 2021–22 levels. Separately reframes the long end as a structural savings shortage rather than a cyclical overshoot |
| Mike WilsonMorgan Stanley | 8,000 year-end, 7,000 retest in base case | Same, plus a 30-day correction clock | Added a condition rather than changing a number: oil at $120–140 drains liquidity. Explicitly rotating rather than reducing, which is the distinction the wire coverage dropped |
| Tom LeeFundstrat | Fed holds Wednesday; “face-ripper” rally to follow | Restated Sunday evening rather than withdrawn, against 86.5% pricing. Gasoline is 2.2% of the consumer wallet against 6.5% in the 1980s embargo and 4.5% pre-crisis — his case that this oil shock does not compel a hike | |
| Rick RiederBlackRock | A hike “does not make much sense” given the data | Made in August and not revised. The largest active bond manager on the planet is on the wrong side of an 86.5% strip with two days to go | |
| Savita SubramanianBofA | Street-low 7,100 year-end target | The index sits 7.8% above it with fifteen weeks left and no revision published. At some point an unrevised target stops being a bear call and becomes a stale one | |
The only pipeline that bypasses Hormuz is shut, the talks that were meant to reopen the strait are postponed, and gold fell on both
The barrel is the macro story and the mechanism is physical rather than financial. Saudi Arabia shut the East-West crude pipeline on Friday, after drone strikes launched from Maysan province in Iraq. That line is the kingdom’s principal route for moving crude to the Red Sea without passing through the Strait of Hormuz: nameplate capacity is roughly seven million barrels a day and recent throughput has been running nearer four to five. Hormuz itself has been effectively closed since late February, and the UAE’s Habshan–Fujairah line is the only other bypass of any scale left running. Separately, the Iran–Gulf talks on a temporary Hormuz shipping corridor, scheduled for Salalah in Oman today, were postponed on Sunday by the Omani foreign ministry. The single diplomatic process capable of relieving the shortage has slipped, and the single physical workaround has stopped. Nameplate is one thing and throughput another: the line had been moving four to five million barrels a day, or four to five per cent of global supply. WTI is at $103.18, up 3.13% overnight and up 9.7% last week; Brent is at $107.83.
RBC’s Helima Croft is the only commodity strategist with fresh primary work on it, and her arithmetic is the number that should frame the whole week: roughly nine million barrels a day of Middle Eastern supply now sits effectively offline. Her conclusion follows from it — “millions of Middle Eastern barrels remain effectively stranded assets, making previous White House calls to OPEC futile.” A cartel cannot open taps that are physically unreachable. She also logs the escalation that the equity tape has not yet marked: in a single twenty-four-hour stretch the United States sank five Iranian tankers near the export facilities at Kharg Island and Jask, while Iran said it had fired on two US Navy ships and eight tankers and launched ballistic missiles at US bases in Jordan. Alongside that, Ukrainian strikes are keeping roughly three million barrels a day of Russian refining capacity offline, and Saudi Red Sea exports have fallen under two million a day. With retail petrol near $4.20 and diesel at $6, she notes the administration faces this with midterm elections under two months out.
The tell that this is being priced as a cost shock rather than a reflation is in the metals. Gold is down 0.73% overnight on a night the Middle East escalated, silver down 0.93%, copper down 0.92%. Gold has now fallen for three consecutive weeks and is down on the month, against a spot price that made an all-time high in January. A war headline that sells gold is a war headline the market has decided will be answered with higher real rates rather than with debasement. That is a very specific reading of Wednesday, and it is the one the whole commodity complex has adopted.
The rate structure agrees. Friday closed with the two-year at 4.63%, the ten-year at 4.97% and the thirty-year at 5.36%, with the ten-year at its highest since October 2023. Over the past month the two-year has added roughly 45 basis points against the ten-year’s 25, bear-flattening 2s10s to +35 basis points. That is the curve of a market pricing a central bank that will act, not a market pricing an economy that will overheat. The futures are flat overnight — the December ten-year note is unchanged and the bond is seven ticks lower — because the move has already happened and the next leg needs the dot plot.
The plumbing has one bruise worth noting. Last week’s Treasury buyback repurchased only $5.2 billion against a $6 billion cap on $10.5 billion offered, and yields rose on the shortfall. A buyback that cannot fill its own size is a demand signal, not a supply management tool, and it lands in the same week that Slok is arguing the long end is structurally rather than cyclically cheap. On the other side of the fiscal ledger, the shutdown risk that hung over August is gone: Congress passed a continuing resolution funding the government through 11 December.
And this is not an American week alone. The Bank of England decides on Thursday with UK inflation printing the day before, and the Bank of Japan decides on Friday with Japanese consumer prices the same morning — the Japanese ten-year is already at 2.99%, a level last seen in the 1990s. Eurozone inflation lands Thursday. Three major central banks and three inflation prints inside seventy-two hours, all of them into the same oil shock, and the Federal Reserve goes first.
The book rolls this week, the protection is cheap, and the only thing anybody is actually trading this morning is an essay
Start with the mechanical calendar, because for once it is unusually crowded and unusually knowable. The roll finishes over the next two sessions, which means depth is split across two contracts precisely as the committee votes, and behind it sit the quarterly expiry and the index rebalance on the same Friday.
Into that, Citadel Securities’ Scott Rubner has the positioning observation that matters: S&P 25-delta skew is in the first percentile of the past year. Downside protection has essentially never been cheaper relative to upside in this cycle, and it is cheap going into the one week of the quarter with a central bank decision, three foreign central banks, a record-challenging expiry and a contract roll stacked on top of each other. His seasonal work points the same way — the second half of September is historically the weakest two-week stretch of the year at −0.91% on average, and midterm-year Septembers average −1.5% with an average drawdown of −6.2%. His conclusion was to use strength to reduce exposure and add protection, and to treat September as a tactical window rather than a turn, with a better setup from mid-October.
None of that describes a book that has to sell. It describes a book that has nothing left to buy and is holding protection it got at a discount. The distinction matters for how a bad print transmits: forced selling is fast and mechanical, and hedged selling is slow and negotiable. This week the market has more of the first than the second.
Single names
The AI complex is the entire single-name story this morning, and it is not an earnings story. Anthropic safety researcher Jacob Coxon resigned on 9 September with a seven-part public post — he had spent three years on pretraining research at OpenAI and then Anthropic, and said neither company is acting responsibly, that they are “racing straight to self-improving superintelligence and gambling with our lives.” The post ran to tens of millions of views, was followed by a national television round, and has now reached the pipeline for AI listings. The transmission channel into prices is semiconductors, which is why the Nasdaq contract is carrying almost all of the overnight decline while the Dow contract sits unchanged.
Altimeter’s Brad Gerstner spent a full Halftime Report hour on Friday attacking it, and he is worth quoting because he is an investor in both Anthropic and OpenAI and disclosed as much on air: “What I didn’t like this week is these hyperbolic scare tactics, which I think are hiding behind a political agenda.” On the coordinated broadcast round: to put “a single researcher who spent six weeks at Anthropic” on four networks to “tell the moms and dads of America that this can kill all of humanity in the next three years without any countervailing conversation is deeply irresponsible.” He also made the one policy point the market should care about, on Chinese distillation of US frontier models: “I don’t want to hand our adversaries capabilities that we shut down ourselves.”
The reason a governance story reaches the tape at all is the accountability gap underneath it, and two independent measures frame it. Apollo’s survey work has 69% of S&P 500 companies citing a live artificial-intelligence deployment, up from 64% a quarter earlier, but only 29% quantifying a result, 2% tracking a metric over time, and none breaking the spending out as a profit-and-loss line. Against that, Goldman Sachs’ Ben Snider estimates that AI investment spending is driving about half of S&P 500 earnings growth, and notes his firm’s composite positioning indicator is at its lowest since March even with the index near a high. Half the earnings growth of the index rests on a capital cycle that two per cent of its participants are measuring.
Apple remains the widest analyst dispersion in the mega-cap complex after the iPhone event: TD Cowen’s Krish Sankar at $400 is the street high, with BofA at $380, HSBC at $366 and Evercore ISI at $365, against Barclays’ Tim Long at Sell and $245 and KeyBanc underweight at $250. Morgan Stanley’s Erik Woodring calls the foldable the most consequential launch since the iPhone X and models roughly $14 billion of December-quarter contribution. A $155 spread between the highest and lowest published target on the largest company in the index is not a disagreement about a quarter; it is a disagreement about what the company is.
Marvell carries BofA’s Vivek Arya at Buy and $365 on a custom-AI addressable market he sizes at $300 billion by 2030 — the stock has nearly tripled this year, so it is the most levered name in the complex to Saturday’s headline. RH had its target cut to $210 from $240 by Morgan Stanley’s Simeon Gutman, who keeps Overweight — a housing-adjacent cut two days before Lennar reports into a seven-per-cent mortgage. Netflix is carrying a Florida attorney-general suit over children’s data filed on 9 September, which the company calls meritless; it is an overhang rather than a profit event. On the tape today, Dave & Buster’s after the bell at a consensus of $0.18 is the only report of any kind.
Eighty-six and a half per cent, a chair who has never moved, and a core rate at a five-year low
The September meeting is priced at an 86.5% chance of a twenty-five basis point increase to 3.75–4.00%, a 13.5% chance of a hold, and precisely zero probability of easing at any horizon — against a current target range of 3.50–3.75%. The trajectory is the story: roughly 30% before Jackson Hole, 66% at the start of September, about 71% after the producer price release on the 10th, and 86.5% now. Two data points did almost all of that work, and both were prices rather than quantities.
Behind the single meeting, the strip carries more than one move. The December fed funds contract implies an average effective rate of 4.08% for that month and the March 2027 contract implies 4.29%, against an effective rate of roughly 3.63% today. That is around forty-five basis points priced by the turn of the year and sixty-six by the first quarter — so the futures market is not asking whether the committee moves on Wednesday, it is asking how quickly it moves again afterwards. Charlie Bilello’s framing of the same point is the two-year note, which at 4.63% sits a full percentage point above the effective funds rate; he calls that the widest gap since November 2022, the last time the committee was visibly behind the curve, and reads it as the market pricing more than one increase.
Citi’s economists have published the most specific roadmap on the tape, and it is worth reading as a base case rather than as a forecast. They expect a “dovish hike”: twenty-five basis points, the median 2026 core PCE projection revised down from 3.3% to roughly 3.0%, a median dot signalling one further increase this year for two in total, and Chair Warsh framing the move as a “calibration” rather than the start of a cycle — with Governor Waller and three of the regional presidents who dissented for a hike in July joining, leaving minimal dissent on the statement. If that is the shape of it, the decision is the least interesting part of the afternoon and the projections are everything.
The genuinely new development, and it happened inside seventy-two hours, is that the argument stopped being about whether the Fed hikes and became about which outcome equities should want. On Thursday Jeremy Siegel described himself as “right on the borderline” and said Chair Warsh is “going to bite the bullet and raise rates” because a hold could draw “four or five or maybe six dissents, which would be unprecedented.” His sequencing is the one to carry into Wednesday: “the market will first shudder and you’ll see a selloff,” and then, if the long bond reads the move as credible, a recovery — “a first kind of a cold shower. Oh wow. But we needed that.” He has moved from bullish to neutral on the next several weeks, calling range-bound “probably the best that we can expect.”
By Friday the reframe was complete. Schwab’s Kevin Gordon put the asymmetry plainly: if the committee did not hike, “you would probably have a negative response in the long end,” and given the tight negative relationship between yields and equity prices, “that would be a negative day, or a negative response series of days, for the stock market.” He read Friday’s rally as the market pricing the hike in, not against it — “a bit of a sell the rumour, buy the news event.” Empower’s Marta Norton supplied the capitulation: she had been in the no-hike camp and has been “forced to move,” partly because Iran now “feels much more like a semi-permanent situation rather than a one time supply shock,” which is how a supply shock starts affecting core. Her caution is about the other side of the ledger: she doubts a short-end move brings the long end down much, because the structural drivers there are hyperscaler debt issuance and fiscal supply. So the consensus among the people who will be asked about it on air is now that a hike is the bullish outcome and a hold is the dangerous one — which is precisely the trade that is crowded going in.
What makes the argument genuinely unsettled is the composition of the inflation data the committee is acting on. August headline consumer prices ran +0.4% month-on-month, the strongest in three months, and 3.4% year-on-year. Core ran +0.3% month-on-month, hotter than the +0.2% consensus and the firmest since April — but core year-on-year printed 2.4%, the lowest since March 2021. The Fed is preparing to raise rates for the first time in three years at a moment when its cleanest measure of underlying inflation is at a five-year low, and when the thing actually pushing the headline up is a barrel of oil that no policy rate can produce. That is the substance of Mohamed El-Erian’s objection in Section 05, and it is why Jim Bianco has described the meeting as a lean hike rather than a done deal while arguing that bond bulls should want it anyway — a credible inflation fighter pulls long yields down, not up.
Nobody at the Fed can address any of this before the statement. The communications blackout has been in force since 5 September and runs through the 17th; there is no speech, no testimony and no interview between now and Wednesday afternoon, and the first voice out afterwards is Vice Chair for Supervision Michelle Bowman on Friday morning, in London, on stress testing. The whole of the committee’s public position remains what Chair Warsh said at Jackson Hole on 28 August: that underlying inflation has not meaningfully improved, that the Fed has “work to do,” and that he would return inflation to target “at sufficient speed.” He has held at every meeting he has chaired. Prices have been above the two per cent target for more than five years. Both of those facts get resolved on Wednesday at two o’clock, and the retail sales report that lands five and a half hours earlier is the last input either side gets.
Three observations that survive checking
The Hormuz shock is showing up in cracks, not crude — and the crack is the inflation instrument
Everyone is watching the barrel. The barrel is the wrong instrument. Jefferies’ Sam Burwell put it plainly back in mid-August, and it has aged well: global oil-market tightness is “manifesting itself in cracks, not crude, at least for now.” The front-month US ultra-low-sulphur diesel crack set an all-time record above $106 a barrel on 1 September. Retail diesel has kept going since: a record $6.05 a gallon on Friday and $6.16 on Saturday, against $3.70 a year ago — up roughly 66% year-on-year, and up eleven cents in a single day over a weekend on which the pipeline news had not yet been priced. This morning the October heating oil contract is up 2.86% against crude’s 3.13%.
The reason is that three of the world’s four refining hubs are impaired at once, and the causes are unrelated to each other, which is why nothing is arbitraging them away. BofA’s Francisco Blanch lists them: the Hormuz closure plus the strike on Saudi’s Jazan refinery, record Russian refining outages from drone strikes compounded by Moscow’s own diesel export ban, and China still declining to restart product exports. Citi’s Anthony Yuen has global diesel inventories below their five-year minimum — last seen in 2022, when gasoil cracks were roughly twenty dollars a barrel lower than they are now. Goldman’s Daan Struyven has Persian Gulf diesel flows down 80% year-on-year against 48% for crude.
Why a futures trader should care this morning rather than eventually: diesel is the input cost of physically moving everything, it feeds core goods and services with a lag, and it is landing two days before a committee that is 86.5% priced to hike. It is simultaneously a margin windfall for refiners and a margin tax on truckers, rails, airlines and industrials. And it means the crude screen can look calm while the energy shock keeps compounding one layer downstream. Watch the heating oil contract, not West Texas.
The Federal Reserve decides in the thinnest liquidity window of the quarter, and the market chose the date by accident
Three mechanical events land inside five sessions and nobody scheduled them together. The equity index roll finishes this week and September stops trading on Friday, so depth is split across two contracts through Wednesday. Roughly $6.2 trillion of US options notional expires Friday, about 23% of total US options exposure, tracking to challenge June’s record. And the S&P index rebalance is the same session. The FOMC statement lands in the middle of that, on the day when depth in each individual contract is at its lowest of the quarter.
The consequence is not directional, it is about slippage. The same order that moves the December contract two ticks in a normal week moves it four in a roll week, and the option book that has been absorbing shocks since July stops absorbing them on Friday morning. Combine that with a corridor only a hundred points wide against a fourteen-day average true range of 61.78 points, and the arithmetic says one ordinary reaction to the dot plot travels most of the distance from wall to wall before anybody has decided what the dots mean.
The tradeable observation is that the market has priced the outcome and not the mechanics. Skew is in the first percentile of the year and implied volatility on the index is in the bottom seventh of its own range. Protection into a thin book is the one thing this week that is objectively cheap, and it is cheap for a reason that has nothing to do with whether Wednesday goes well.
The Fed is about to hike with core inflation at a five-year low
The number every desk quoted on Friday was the core month-on-month at +0.3%, a tenth above consensus, and it took hike odds from roughly 71% to 86.5%. The number almost nobody printed is on the same release: core CPI year-on-year came in at 2.4%, the lowest reading since March 2021. Headline is at 3.4% because energy has done what energy does when the Strait of Hormuz is closed. Strip the barrel out and the underlying series is at a five-year low and still falling.
That configuration — hiking into a decelerating core because a supply shock is lifting the headline — is unusual enough that it deserves to be named rather than assumed. It is exactly the case the dissenters are making: a policy rate cannot reopen a shipping lane or restart a refinery, and raising it taxes the parts of the economy that are functioning in order to be seen responding to the part that is not. It is also, uncomfortably, the case for moving, if what the committee is defending is not this month’s core print but the expectation that five years above target has begun to embed.
Either way it changes how to read Wednesday. If the hike is about anchoring expectations rather than about current inflation, then the statement language and the 2026 core PCE dot — which Citi expects revised down — matter more than the twenty-five basis points, and a downward revision to the inflation projection alongside an increase in the policy rate is a combination the equity market has no recent template for. The market has spent a fortnight pricing the verb. It has not priced the reason.
Legal Disclosure & Risk Warning — Cannon Trading Company
This publication is provided by Cannon Trading Company for informational and educational purposes only. Content may include market commentary, technical observations, analyst opinions, and aggregated material derived from publicly available sources. While such information is believed to be reliable, Cannon Trading Company does not author, independently verify, endorse, or guarantee the accuracy, completeness, or timeliness of any third-party information referenced or summarized herein.
The information, opinions, market data, and commentary contained in this publication are subject to change at any time without notice and do not constitute investment advice, a solicitation, or a recommendation to buy or sell any security, futures contract, option on futures, foreign currency transaction, or any other financial instrument.
Past performance is not indicative of future results.
Trading Futures, Options on Futures, retail off-exchange foreign currency transactions, and other derivatives involves substantial risk of loss and is not suitable for all investors. You may lose all or more than your initial investment. Carefully consider whether trading is appropriate for you in light of your experience, objectives, financial resources, and other relevant circumstances.
Cannon Trading Company does not guarantee any profits and makes no representation that the strategies, ideas, analyses, or information presented will result in profitable trades or avoid losses. Any market views, analyst calls, forecasts, or third-party commentary referenced reflect the opinions of their respective authors and may or may not align with the views of Cannon Trading Company.
Cannon Trading Company is registered solely as a commodities broker. Nothing contained herein constitutes the provision of investment advisory services.
© 2026 Cannon Trading Company, Inc. All rights reserved.