Commodity Future Trading

Commodity Future Trading


How Does Crude Oil Affect Gas Prices? What Else Does?

November 6th, 2013 Filed under Commodity Trading, Crude Oil | Comments Off on How Does Crude Oil Affect Gas Prices? What Else Does?

The answer to the question in the title of this piece was stated pretty assuredly in a 2005 publication by the Federal Trade Commission. The most important factor in the price of gasoline, the 166-page report concluded, was “the world price of crude oil“. It went on: “Over the last 20 years, changes in crude oil prices have explained 85% of the changes in the price for gasoline in the U.S.”1 And there aren’t too many macro-unknowns out there to affect the price of crude oil. The world produces roughly 85 million barrels of oil every day and every day the world’s population consumes about 90 million barrels. And the generally accepted relationship between crude oil and gasoline is that for every $1 dollar per barrel crude oil moves, gas prices move about 2 ½ cents at the pump. It’s also generally accepted that there’s approximately 1.5 trillion barrels of oil yet to be extracted from the planet – what are called proven reserves – equal to about 50 more years of supply based on our current consumption rate. And according to OPEC’s web site, that cartel – created over 50 years ago – controls about 80% of those reserves.
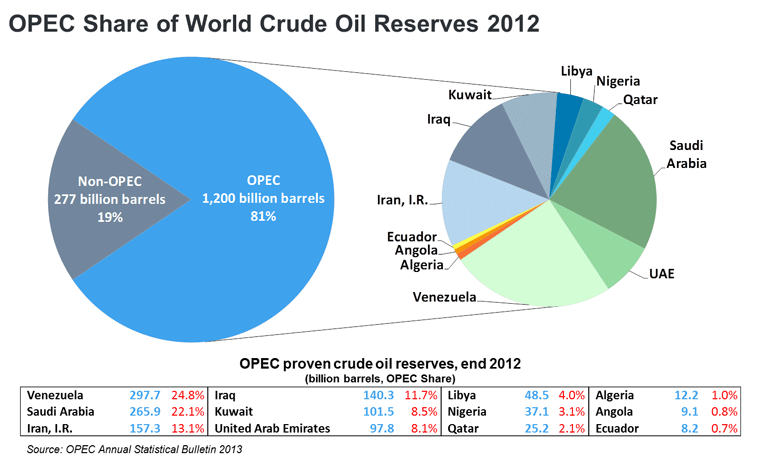
OPEC Share of World Crude Oil Reserves 2012

OPEC Share of World Crude Oil Reserves 2012

Account for some margin of error and those are all pretty workable numbers for a global commodity like crude oil to live with. The quandary for tracking gas prices isn’t that you can’t measure them accurately against the price of crude oil. That relationship is pretty ingrained. It’s the many other factors that also come into play – at different levels of influence and intensity and at irregular intervals – that cause gasoline prices to move.

Just take a look at the last 6 months. Crude oil shot up over 20% from $86 per barrel to almost $110 per barrel. It then fell over 10% back down to near $96 per barrel.

Read the rest of this entry »


30 Yr Bonds & 10 Yr Notes – Trading Levels & Economic Reports for 11.05.2013

November 4th, 2013 Filed under Commodity Trading, Future Trading News | Comments Off on 30 Yr Bonds & 10 Yr Notes – Trading Levels & Economic Reports for 11.05.2013

Connect with Us! Use Our Futures Trading Levels and Economic Reports RSS Feed.

Like us on FacebookFollow us on TwitterView our profile on LinkedInFind us on Google+Cannon Trading Futures Trading Resistance & Support Levels and Economic ReportsFind us on Yelp

1. Market Commentary
2. Futures Support and Resistance Levels – S&P, Nasdaq, Dow Jones, Russell 2000, Dollar Index
3. Commodities Support and Resistance Levels – Gold, Euro, Crude Oil, T-Bonds
4. Commodities Support and Resistance Levels – Corn, Wheat, Beans, Silver
5. Futures Economic Reports for Tuesday November 5, 2013

Hello Traders,

For 2013 I would like to wish all of you discipline and patience in your trading! 

Each market has different personality, different behavior along with different times of the day when it is most active. If you are finding that the ES is not giving you enough risk/opportunities then start monitoring a couple of other markets and perhaps explore them in demo / simulated mode.

I will try over the next few blogs to shed some light on other markets i think are suitable for day-trading along with what is unique about these markets, personality and most active trading hours.

Today I am going to start with interest rates, mostly the ten year and 30 year.

In most platforms, the symbols are ZB for 30 year bonds and ZN for 10 year notes. The current front month is December which is Z. So ZBZ3 for example.


Product Symbol ZB
Contract Size The unit of trading shall be U.S. Treasury Bonds having a face value at maturity of one hundred thousand dollars ($100,000) or multiples thereof
Price Quotation Points ($1,000) and 1/32 of a point. For example, 134-16 represents 134 16/32. Par is on the basis of 100 points.
Product Symbol ZN
Underlying Unit One U.S. Treasury note having a face value at maturity of $100,000.
Deliverable Grades U.S. Treasury notes with a remaining term to maturity of at least six and a half years, but not more than 10 years, from the first day of the delivery month. The invoice price equals the futures settlement price times a conversion factor, plus accrued interest. The conversion factor is the price of the delivered note ($1 par value) to yield 6 percent.
Price Quote Points ($1,000) and halves of 1/32 of a point. For example, 126-16 represents 126 16/32 and 126-165 represents 126 16.5/32. Par is on the basis of 100 points.
Tick Size
(minimum fluctuation)
One-half of one thirty-second (1/32) of one point ($15.625, rounded up to the nearest cent per contract), except for intermonth spreads, where the minimum price fluctuation shall be one-quarter of one thirty-second of one point ($7.8125 per contract).
Contract Months The first five consecutive contracts in the March, June, September, and December quarterly cycle.


These contracts are often affected by many of the economic reports that come out at 8:30 Am Eastern and there is very active volume between the hours of  8 am EST and 3 PM EST.

Volume on both contracts is very good. Ten years will often have 1 million contracts traded per day ( might be the second most active US futures market after the mini SP 500) and the bonds will avg. around 300,000 contracts.

These markets can experience very volatile movements during and right after different reports but then will often trade smooth or in an intraday trend the rest of the day.

Follow these two markets in demo mode for a while if you have not traded them before and get a feel for the movement, reaction to reports, execution etc.

If you have any questions, feel free to contact me.

Read the rest of this entry »


Real Time Trade Alerts – Trading Levels & Reports for 11.01.2013

October 31st, 2013 Filed under Commodity Trading, Future Trading News, Futures Trading | Comments Off on Real Time Trade Alerts – Trading Levels & Reports for 11.01.2013

Connect with Us! Use Our Futures Trading Levels and Economic Reports RSS Feed.

Like us on FacebookFollow us on TwitterView our profile on LinkedInFind us on Google+Cannon Trading Futures Trading Resistance & Support Levels and Economic ReportsFind us on Yelp

1. Market Commentary
2. Futures Support and Resistance Levels – S&P, Nasdaq, Dow Jones, Russell 2000, Dollar Index
3. Commodities Support and Resistance Levels – Gold, Euro, Crude Oil, T-Bonds
4. Commodities Support and Resistance Levels – Corn, Wheat, Beans, Silver
5. Futures Economic Reports for Friday November 1, 2013

Hello Traders,

For 2013 I would like to wish all of you discipline and patience in your trading! 

To continue our mini Dow story from yesterday….After the close I got one of my “reversal” indicators to generate a sell signal as a counter trend trade. Personally to me, it gave a bit more confidence in the short side of the trade, HOWEVER, I think that actual trade management, where to place a stop, where to take profits, do you place a limit order for the target or do you just trail your stop ? these and other questions are probably the most important factors when it comes to success or failure of trades.


Daily chart for your review below.


YM - E-Mini Dow Futures - $5 Multiplier, Equlaized Active Daily Continuation

YM – E-Mini Dow Futures – $5 Multiplier

On a different note, I have a daily newsletter where I share trade set ups like the one above:


Get Real Time Trade Alerts Service via text and email
Would you like to receive a 30 day free trial to a new trade alert service?

Get new buy/ sell ideas along with suggested stops and profit targets in real time.

This trade alert service was developed and published by LEVEX Capital Management Inc.  ( “LEVEX”) a registered CTA with the CFTC and member of the NFA.

“LEVEX” will transmit alerts via text and/or email with potential buy and sell recommendations for different commodities along with suggested stops and profit targets. The alerts are based on technical analysis and using a computerized model developed by “LEVEX”.

Each day the program runs a market scan to look for markets that fit certain technical criteria / trade algorithm developed by LEVEX Capital management Inc. Once a market has been identified as a possible high probability set up, you will receive a trade alert with the trade idea.

Read the rest of this entry »


Different Ways to Invest in Commodities and Futures

October 28th, 2013 Filed under Commodity Trading, Futures Trading | Comments Off on Different Ways to Invest in Commodities and Futures

When it comes to investing in commodities/futures there are several different ways to do so. I’ve been a futures broker at Cannon Trading Company for about 4 years and I wanted to touch base on a few different ways I have seen clients trade and invest in futures and commodities over the years.

I have seen many investors (small and large) participate in trading ETFs or ETF funds. With ETFs you do not own the actual commodity but you are looking to track the performance on either a single commodity or commodity index containing many different commodities through either its physical storage or derivatives positions in the market.

I do not accommodate trading ETFs or ETF funds with my actual clients. I am a registered futures broker and here at Cannon Trading Company we do not accommodate ETF trading for our clients. Please keep in mind the differences when trading ETFs versus commodities and futures. With ETFs you may experience management fees where as if you have a self directed futures and commodities trading account you will not experience those types of fees. Also when trading futures, unless you have a limited power of attorney on your account where you authorize another individual to trade your account, there is not a third party making your trading decisions and trading your account on your behalf. Here, at Cannon Trading Company many futures/commodities trader have self directed accounts where he or she makes their own decisions when it comes to trading.

Read the rest of this entry »


A Quick History of U.S. Futures Trading

August 19th, 2013 Filed under Futures Trading | Comment (0)

Futures contracts are one of the most important financial innovations in history, but they are often misunderstood. These contracts are used to transfer risk between different parties. Futures markets originated as a way for producers to stabilize their income and/or raw material supply amid market fluctuations, but it soon grew into a way for speculators to bet on the direction of a given commodity. These two market forces interact to create the futures markets that we know today and each plays a critical role in the market’s dynamics.

Forward contracts vs. Futures contracts

Before the North American futures market originated some 150 years ago, farmers would grow their crops and then bring them to market in the hope of selling their inventory. But without any indication of demand, supply often exceeded what was needed and unpurchased crops were left to rot in the streets! Conversely, when a given commodity – wheat, for instance – was out of season, the goods made from it became very expensive because the crop was no longer available.

If you like this Article, Please share!

Futures Trading Levels

Read the rest of this entry »

Have A Questions? Open an account Free Demo Account Free Demo Account

Question?

Valid first name is required.
Valid last name is required.
Phone number is required.
E-mail is required.
Message is required.
Phone (USA)
Phone (International)
Our Approach

You and your broker will work together to achieve your trading goals. We develop long term relationships with our clients so that we can grow and improve together.
Learn More About Choosing Cannon

Our Platforms

Please click on one of our platforms below to learn more about them, start a free demo, or open an account.
E-Futures Sierra Charts Firetip (Mac Compatible) RTrader

________
Doing Business With
See more...
Loading
Loading

Loading