Cannon Futures Weekly Newsletter Issue # 1044
Dear Traders,
Get Real Time updates and more on our private FB group!
Trading 102: Day Trading Commodities with Crude Oil Futures
Crude Oil Futures Volatility Offers A “Different Market Personality” Than Stock Index Futures. Here Is Some Of The Things You Need To Know About Day Trading Crude Oil Futures:
By: Ilan Levy-Mayer, Cannon Trading Commodities Broker & VP
Crude Oil is one of MY favorite
futures market for day trading. Before I dive in and share with you how the volatility in crude oil fits my risk tolerance for day trading and provide a couple of chart examples, we should review some of the specifications of
Crude Oil Futures.
Crude Oil Futures have monthly expiration. So each month we trade a different contract month, so one needs to know when is the first notice day and last trading day for crude oil futures in order to always make sure we are trading the proper month with the most liquidity and avoid any chance of getting into delivery situation.
Next is the contract size. Crude Oil futures are based on 1000 barrels. To be honest from a day trading perspective all I care is that each tick or 1 cent fluctuation is $10 against me or in my favor per contract. That means that a move from 92.94 to 92.74 = $200.
Another factor is trading hours. At the time I am sharing my thoughts with you, April 8th 2013, crude oil futures trade on the CME Globex platform and trade from 5 PM CDT until the next day at 4 PM CDT. That is 23 of straight trading hours. I definitely don’t recommend day trading this market 23 hours…but it is good to know the trading hours.
Volume in crude oil futures is pretty good to trade in my opinion. Averaging about 300,000 contracts per day.
One last pointer to touch on is the API (American Petroleum Institute) report that normally comes out Wednesday at 9:30 CDT (on short weeks, holidays etc. , this report will be pushed to Thursday at 10 AM CDT). I tell my clients that this report is way too volatile and I like to be out 5 minutes before and not resume trading 5 minutes until after the report comes out. This report by itself deserves a writing but on short, the report provides information on how our stock pile is doing ( = supply/demand) and the market will move based on the numbers versus what was expected. Again as a day trader, your main job is to know about this report, when it comes out and in my opinion stay out of the market during this time..Fill out the form below to read the full article.
Trading Futures, Options on Futures, and retail off-exchange foreign currency transactions involves substantial risk of loss and is not suitable for all investors. You should carefully consider whether trading is suitable for you in light of your circumstances, knowledge, and financial resources. You may lose all or more of your initial investment. Opinions, market data, and recommendations are subject to change at any time when it comes to Futures Trading.
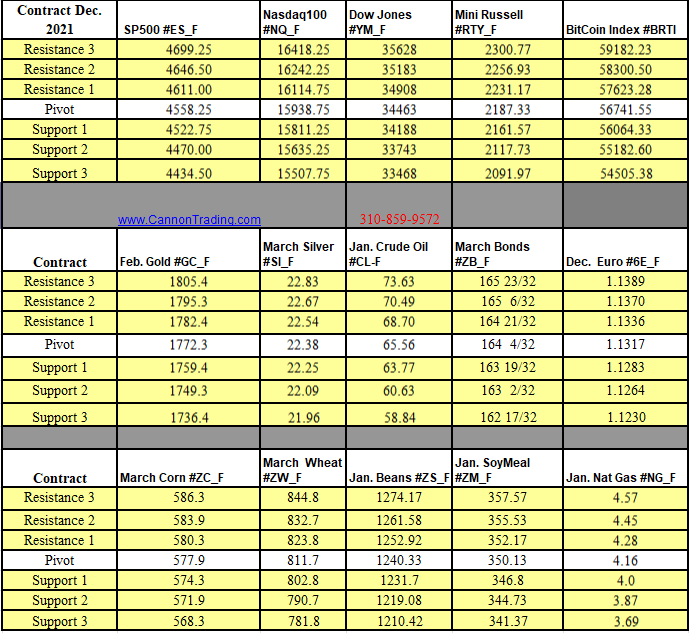
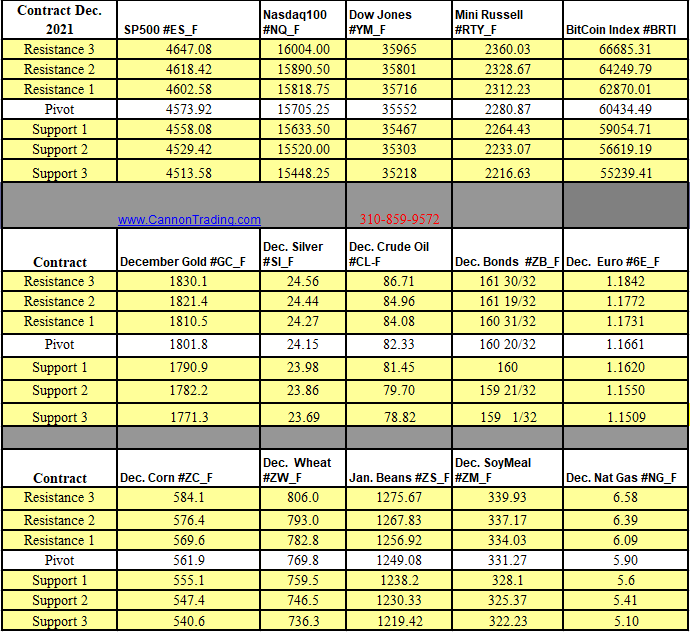
Futures Trading Levels
3-22-2021

Weekly Levels

Reports, First Notice (FN), Last trading (LT) Days for the Week:
https://mrci.com
Date Reports/Expiration Notice Dates

This is not a solicitation of any order to buy or sell, but a current market view provided by Cannon Trading Inc. Any statement of facts herein contained are derived from sources believed to be reliable but are not guaranteed as to accuracy, nor they purport to be complete. No responsibility is assumed with respect to any such statement or with respect to any expression of opinion herein contained. Readers are urged to exercise their own judgment in trading