Crude Oil Futures Chart

Crude Oil Futures Chart


Crude Oil Futures Testing Major Weekly Support Level, SP500 Volatility Higher + Levels for 8.6.2014

August 5th, 2014 Filed under Commodity Trading, Crude Oil, Day Trading, Energy Futures, Future Trading News, Index Futures | Comment (0)

Hello Traders,

For 2014 I would like to wish all of you discipline and patience in your trading!

Volatility has picked up again! Make sure you adapt as markets are always changing and what may work for range bound/ low volatility days will not work for wide range/ higher volatility days.

I see major support for SP500 at 1795 and it will be interesting to see price reaction if we test this level in the next few days.

On a different note, I wrote a quick analysis along with chart for Crude Oil futures at:

http://experts.forexmagnates.com/crude-oil-attempting-break-lower/

Read the rest of this entry »


Crude Oil and Gold Futures Chart, Futures Levels and Economic Reports 2.12.2013

February 11th, 2014 Filed under Commodity Trading, Future Trading News, Futures Trading | Comments Off on Crude Oil and Gold Futures Chart, Futures Levels and Economic Reports 2.12.2013

Connect with Us! Use Our Futures Trading Levels and Economic Reports RSS Feed.

Like us on FacebookFollow us on TwitterView our profile on LinkedInFind us on Google+Cannon Trading Futures Trading Resistance & Support Levels and Economic ReportsFind us on Yelp

1. Market Commentary
2. Futures Support and Resistance Levels – S&P, Nasdaq, Dow Jones, Russell 2000, Dollar Index
3. Commodities Support and Resistance Levels – Gold, Euro, Crude Oil, T-Bonds
4. Commodities Support and Resistance Levels – Corn, Wheat, Beans, Silver
5. Futures Economic Reports for Wednesday February 12, 2014

Hello Traders,

For 2014 I would like to wish all of you discipline and patience in your trading!


Trader Planet


Voted Best Blog 2013 by Trader Planet

Thanks everyone who voted!! Appreciate your help in winning the #1 blog for futures trading by Trader Planet!! Please feel free to forward our daily blog to friends and other fellow traders who might be interested.

Another two markets I like to touch on when it comes to “other markets to daytrade beside the mini SP 500” are crude Oil and Gold futures.

More than a few similarities between the two markets.

They are both volatile, can move VERY fast. I have seen some very large moves happen in matter of minutes if not seconds. The “fear & greed” factor really plays a role in these specific two markets.

Both have active trading hours starting with Far East trading around 10 PM est all the way to the next morning until about 3 PM est. Good volume generally speaking but not close to the mini SP or ten year notes. So you may see some slippage on stops but the volume is more than enough to trade size.

Each tick on gold is $10, so every dollar move =$100 against you or in your favor. Crude is similar, each tick = $10. One full $1 move = $1000.

Both markets were quiet today relatively speaking but even on a quiet day, the range on gold was  $21 or = $2100 wide using one futures contract. Crude ranges today was less than $1 or about $890 between hi/lo.

I like using overbought/ oversold indicators on the two markets as well as using range / Renko charts.

If you never traded these markets before, I highly recommend exploring in simulation/ demo mode. get a feel for the explosiveness, volatility, personality for a few weeks before trying in live mode.

As always, any questions, please feel free to email me.

Two charts from today’s session of gold and crude for your review below ( if you like to try the charts I am using along with indicators displayed, send me an email):


Crude 18 ticks range bar Feb. 11th 2014

CLE - Crude Lights (Globex), Equalized Active Continuation - Range Bar 18 Ticks Units

Gold, 36 ticks range bar Feb. 11th 2014
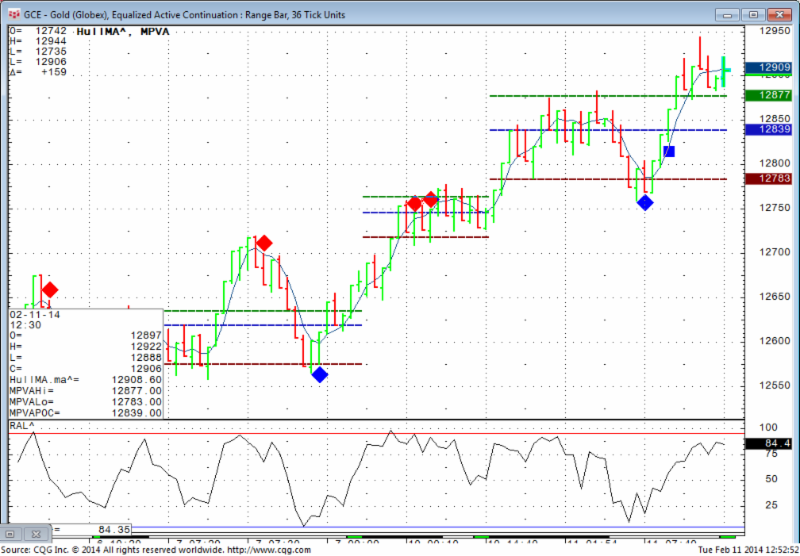
 

GCE - Gold (Globex), Equalized Active Continuation - Range Bar =, 18 Ticks Units

GCE – Gold (Globex), Equalized Active Continuation – Range Bar =, 18 Ticks Units

Read the rest of this entry »


Daily Chart of April Crude Oil Futures

February 27th, 2012 Filed under Commodity Trading, Future Trading News | Comment (0)


Jump to a section in this post:
1. Market Commentary
2. Support and Resistance Levels – S&P, Nasdaq, Dow Jones, Russell 2000
3. Support and Resistance Levels – Gold, Euro, Crude Oil, T-Bonds
4. Support and Resistance Levels – March Corn, March Wheat, Jan Beans, March Silver
5.Economic Report for February 28, 2012

Hello Traders,

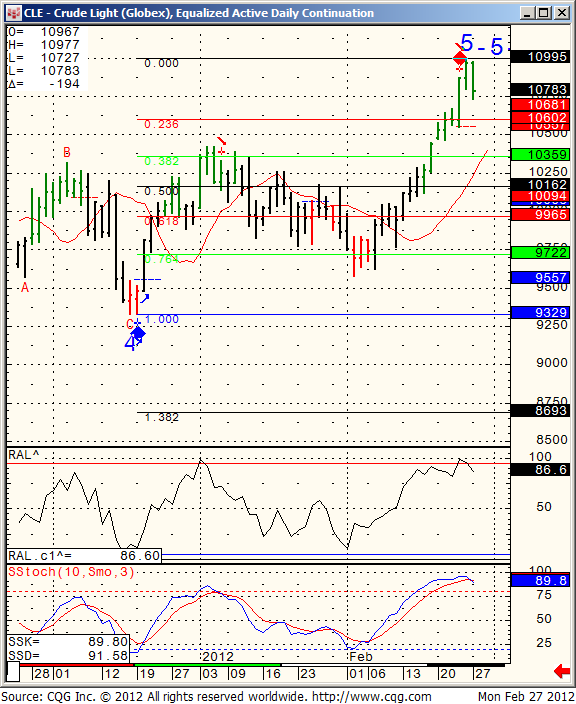
While our stock indices markets ( SP, Dow, NASDAQ and Russell ) been trading in very narrow range ( today was a small exception), the crude oil market continues to show the double edge volatility day-traders are looking for.

Below is a daily chart of April Crude oil futures.
PS: Stock index futures have shown in the past tendency to go through periods of low volatility and then change to periods of high volatility. The VIX index is a good indicator, which i will try to share more about tomorrow but my point is, be ready for shift in volatility and wider ranges on stock indices….as always, the question is when.

CLE - Crude light (Globex), Equalized Active Daily Continuation

CLE – Crude light (Globex), Equalized Active Daily Continuation

Read the rest of this entry »


Futures Trading Levels Feb 28th and Crude Oil Futures Chart

February 26th, 2011 Filed under Crude Oil, Futures Trading | Comment (0)

Cannon Trading / E-Futures.com

Wishing you all a great weekend. Amazing how fast short February went by and Monday will be the last trading day of the month.

I expect the higher volatility we have seen over the last few days to stay with us for a while….so as mentioned before be aware of it, adjust your trading parameters accordingly and stay disciplined!

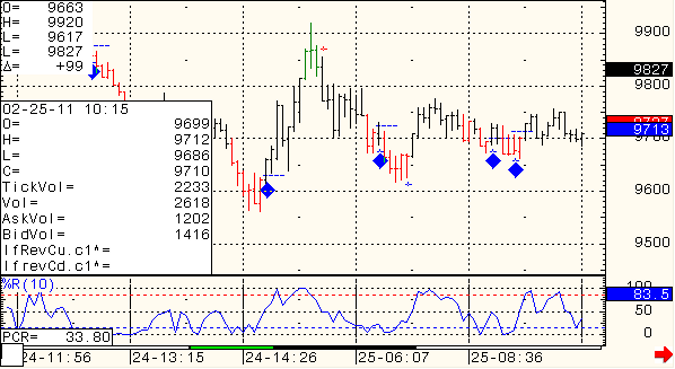
Below you will see a screen shot from the crude oil futures chart I share intraday. We also execute this crude day-trading system in-house as an “auto traded ” trading system with letter of direction.

The day-trading system is up slightly more than $1,000 NET per contract traded since we launched live trading on Jan. 28th 2011.*
*These are risky markets and only risk capital should be used.

Past performances are not necessarily indicative of future results.
If you are interested in more information, would like to see detailed LIVE results, please send me an email or speak with your broker.

Daily E-Mini S&P 500 Futures Trading Chart

Stock futures trading chart levels Read the rest of this entry »

Have A Questions? Open an account Free Demo Account Free Demo Account

Question?

Valid first name is required.
Valid last name is required.
Phone number is required.
E-mail is required.
Message is required.
Phone (USA)
Phone (International)
Our Approach

You and your broker will work together to achieve your trading goals. We develop long term relationships with our clients so that we can grow and improve together.
Learn More About Choosing Cannon

Our Platforms

Please click on one of our platforms below to learn more about them, start a free demo, or open an account.
E-Futures Sierra Charts Firetip (Mac Compatible) RTrader

________
Doing Business With
See more...
Loading
Loading

Loading