Connect with Us! Use Our Futures Trading Levels and Economic Reports RSS Feed.
![]()
![]()
![]()
![]()
![]()
![]()
1. Market Commentary
2. Futures Support and Resistance Levels – S&P, Nasdaq, Dow Jones, Russell 2000, Dollar Index
3. Commodities Support and Resistance Levels – Gold, Euro, Crude Oil, T-Bonds
4. Commodities Support and Resistance Levels – Corn, Wheat, Beans, Silver
5. Futures Economic Reports for Wednesday July 23, 2014
Hello Traders,
For 2014 I would like to wish all of you discipline and patience in your trading!
I mentioned in previous posts that I am getting to like range bar charts and Renko charts more and more when it comes for very short term trading.
The main reason why I like these type of charts along with volume charts when it comes to any time frame less than 10 minutes is because I think it helps filter out noise during slow times and help you get a quicker signal when there is time of heavier action in the market.
Example, let’s say you are using a 5 minute chart along with certain studies, to make a simple example, moving averages cross overs. Before you get a signal, the 5 minute bar has to finish so you can see the value of the moving averages and see if you got a cross over or not. There are times when the market is fast with heavy volume and you may miss 80% of the move because 5 minutes can be a long time for day traders…..On the other hand if you are using Renko/volume charts/Range bars and there is good volume, fast action, these bars will complete much faster to provide a much faster signal. On the same token, if the market is slow with low volume, you will sometimes get your moving averages cross over simply because time has passed….With volume / Renko charts you may be able to filter this out simply because the bars WONT complete unless there is enough volume/ price action. Obviously, these type of charts are by no means “holly grail” but I think one should observe and pay attention to the type of charts especially if you are a short term day trader.
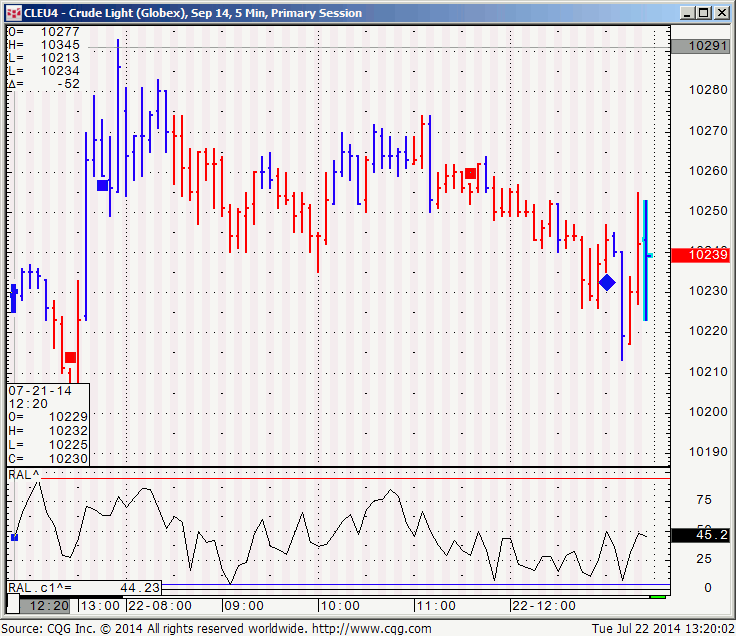
Below is an example of crude oil 18 ticks range bar from today as well as a 5 minutes chart from today with the same studies/ conditions applied just to get a visual idea. If you like to try out the same charts I am sharing, feel free to contact Cannon Futures Trading and we will set you up for a free trial:
Crude Oil 5 minute chart 7-22-2014

Crude Oil 5 Minute Chart 7-22-2014


