Daily Chart of the Mini SP 500

Daily Chart of the Mini SP 500


Daily Chart of the Mini SP 500 | Support and Resistance Levels

January 4th, 2012 Filed under Commodity Brokers, Futures Trading, Metal Futures | Comment (0)

Jump to a section in this post:
1. Market Commentary
2. Support and Resistance Levels – S&P, Nasdaq, Dow Jones, Russell 2000
3. Support and Resistance Levels – Gold, Euro, Crude Oil, T-Bonds
4. Support and Resistance Levels – March Corn, March Wheat, Jan Beans, March Silver
5. Economic Reports for Thursday, January 4, 2012

1. Market Commentary

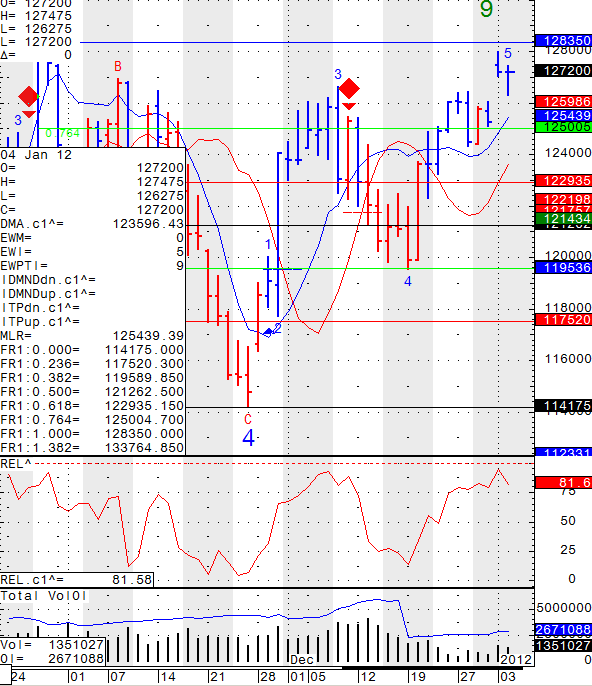
The New year started but seems that some trades are still away from the markets as volume is still considerably lower than average. Today’s trading in mini SP is a good example, choppy trade, less than 1.4 Mil contracts and market end up pretty much unchanged….

I am including a daily chart of the mini SP 500 for your review. I suspect that more volume and volatility will return to the markets in the next few days.

Read the rest of this entry »

Have A Questions? Open an account Free Demo Account Free Demo Account

Question?

Valid first name is required.
Valid last name is required.
Phone number is required.
E-mail is required.
Message is required.
Phone (USA)
Phone (International)
Our Approach

You and your broker will work together to achieve your trading goals. We develop long term relationships with our clients so that we can grow and improve together.
Learn More About Choosing Cannon

Our Platforms

Please click on one of our platforms below to learn more about them, start a free demo, or open an account.
E-Futures Sierra Charts Firetip (Mac Compatible) RTrader

________
Doing Business With
See more...
Loading
Loading

Loading