Elliot Wave International

Elliot Wave International


Crude Oil Futures Market Review and Daily Chart Analysis & Support and Resistance Levels 11.18.2021

November 17th, 2021 Filed under Crude Oil, Energy Futures, Future Trading News | Comment (0)

Dear Futures Trader,

Get Real Time updates and more on our private FB group!

Crude Oil Futures Market Review and Daily Chart Analysis

Looking at both price and time FIB analysis, on the daily crude oil chart below (click here for LARGE IMAGE) I am showing a potential for crude oil to find support and have a short term reversal to the upside. I wont fight the short term trend and will look for a buy signal using 30 minute chart before I jump in front of this downward train…
What do I mean by that?
Daily chart still showing a good strength on the LONGER term scale ( see both Elliott Wave counts and trend strength). Short term we can see the strong sell of the highs made towards the end of October.
I ran both a Fibonacci retracement on prices from lows to high, as well as Fibonacci TIME retracement from the time of lows to highs to see the next TIMING window to look at.
We are getting close to a match on both time and price ( concept I was made aware of by Carolyn Boroden Strategies for Intraday Trading Fibonacci Retracements | Fibonacci Queen) so I will now look for a bullish trigger in the form of MACD cross over on the 30 minutes chart or possible turning up of RSI on the 30 minutes chart before simply trying my luck…..
As always the key will be risk and trade management if/when set up happens.
Keep in mind FRONT month for crude oil is now January! CLF22
If you are looking for other reference material please contact your Cannon Broker for lists of solid, informative and helpful trading tomes
Crude Oil Futures Daily Chart

Good Trading

Trading Futures, Options on Futures, and retail off-exchange foreign currency transactions involves substantial risk of loss and is not suitable for all investors.  You should carefully consider whether trading is suitable for you in light of your circumstances, knowledge, and financial resources. You may lose all or more of your initial investment. Opinions, market data, and recommendations are subject to change at any time when it comes to Futures Trading.


Futures Trading Levels

11-18-2021
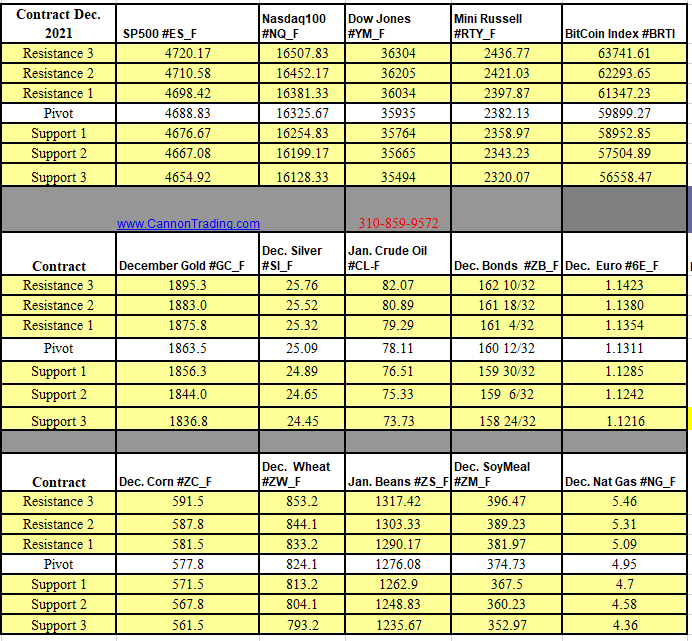
Support and Resistance Levels 11.18.2021


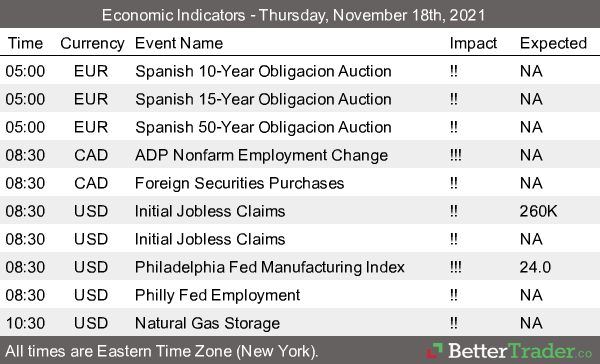
Economic Reports, source: 

https://bettertrader.co/ 

BetterTrader Economic Indicators 11.17.2021


This is not a solicitation of any order to buy or sell, but a current market view provided by Cannon Trading Inc. Any statement of facts here in contained are derived from sources believed to be reliable, but are not guaranteed as to accuracy, nor they purport to be complete. No responsibility is assumed with respect to any such statement or with respect to any expression of opinion herein contained. Readers are urged to exercise their own judgement in trading.


Triangles Offer Traders Important Forecasting Information by Elliot Wave International 4.11.2014

April 10th, 2014 Filed under Commodity Trading, Future Trading News, Futures Trading, Trading Guide | Comment (0)

Connect with Us! Use Our Futures Trading Levels and Economic Reports RSS Feed.

Like us on FacebookFollow us on TwitterView our profile on LinkedInFind us on Google+Cannon Trading Futures Trading Resistance & Support Levels and Economic ReportsFind us on Yelp

1. Market Commentary
2. Futures Support and Resistance Levels – S&P, Nasdaq, Dow Jones, Russell 2000, Dollar Index
3. Commodities Support and Resistance Levels – Gold, Euro, Crude Oil, T-Bonds
4. Commodities Support and Resistance Levels – Corn, Wheat, Beans, Silver
5. Futures Economic Reports for Friday April 11, 2014


Hello Traders,

For 2014 I would like to wish all of you discipline and patience in your trading!

Triangles Offer Traders Important Forecasting Information
Find out about 14 Elliott wave trading insights
By Elliott Wave International

EWI analyst Jeffrey Kennedy explains why triangles offer traders important forecasting information. Take a look at a chart that shows a real-world example of the triangle price pattern, and read Jeffrey’s comments.Read more.

Read the rest of this entry »

Have A Questions? Open an account Free Demo Account Free Demo Account

Question?

Valid first name is required.
Valid last name is required.
Phone number is required.
E-mail is required.
Message is required.
Phone (USA)
Phone (International)
Our Approach

You and your broker will work together to achieve your trading goals. We develop long term relationships with our clients so that we can grow and improve together.
Learn More About Choosing Cannon

Our Platforms

Please click on one of our platforms below to learn more about them, start a free demo, or open an account.
E-Futures Sierra Charts Firetip (Mac Compatible) RTrader

________
Doing Business With
See more...
Loading
Loading

Loading