futures market

futures market


New Week Begins With Continued Futures Market Volatility | Support and Resistance Levels

September 12th, 2011 Filed under Futures Broker, Futures Exchange, Futures Trading | Comments Off on New Week Begins With Continued Futures Market Volatility | Support and Resistance Levels

In this post:

1. Market Commentary
2. Support and Resistance Levels
3. December Mini S&P 500 Continuous Futures chart
4. Economic Reports
5. Highlighted Earnings Releases

1. Market Commentary

FRONT MONTH FOR EQUITIES AND BONDS IS DECEMBER

SYMBOL FOR DECEMBER IS Z

We started the new week, right where we left off. With volatile moves in both directions.

I am sharing my daily Dec. mini Russell 2000 chart with you below.. It seems that at times, the Russell 2000 index has been the leader in the moves of the general stock market. We are currently in a very wide range (volatility definitely expands the “bands”) 739 on top and 654 below.

We are currently closer to the bottom level, hence we may see some more upside before we see sellers step back in. In all honesty, I do NOT have a strong feel for the market right now and do NOT have a preferred way of trading it based on swing or overnight time frame. When I do have a better feel or direction, i will be happy to share with you.

You can also sign up for my real time intraday charts service. Read the rest of this entry »


Futures Trading Levels, High Volatility Futures Markets See Gain Today

August 11th, 2011 Filed under Futures Trading | Comments Off on Futures Trading Levels, High Volatility Futures Markets See Gain Today

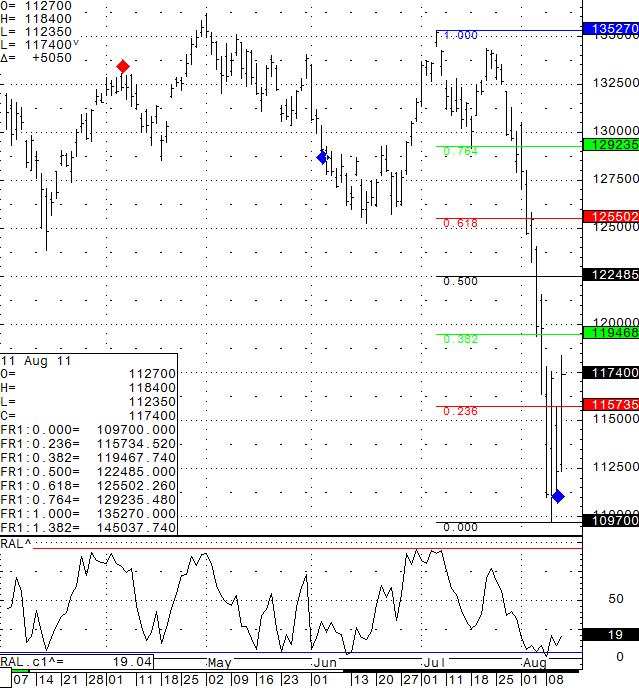
Big up day after what I feel was short term oversold conditions. Daily chart of the BIG SP 500 ( pit session ) for your review below. I think that the 1194 to 1200 psychological level will be the first test to see if this bounce is just a bounce or if it has legs to become a more meaningful recovery. Time will tell…..Either way I think tomorrow, being Friday, before the weekend after a volatile week, will be another high volatility day.

Daily Futures chart of the Big S&P 500 from August 11th, 2011

Daily Futures chart of the Big S&P 500 from August 11th, 2011

Trading Futures, Options on Futures, and retail off-exchange foreign currency transactions involves substantial risk of loss and is not suitable for all investors. You should carefully consider whether trading is suitable for you in light of your circumstances, knowledge, and financial resources. You may lose all or more of your initial investment. Opinions, market data, and recommendations are subject to change at any time.

Read the rest of this entry »


Futures Trading Levels, Types of Trading Days

March 30th, 2011 Filed under Commodity Trading, Future Trading News, Futures Trading | Comment (0)

Cannon Trading / E-Futures.com

The following is taken from a guide I have written that helps subscribers to my daily chart service. You can have a 2 week free trial to the daily live charts service along with buy/sell triggers and get the full guide along with chart examples, rules and much more by signing up at:

Cannon Trading Inc. Day Trading Webinar

General Notes:
At any given day, one must understand the trading environment that specific day has to offer and adjust their trading style accordingly. In our case it relates more to the size of stops and target based on volatility. Some days the market gives us many opportunities; some not as much; and some days it provides us with mostly risks…….take what the market gives you and not what you want it to give…..

I think if a trader understands early enough what type of trading day it is, he or she can choose which tools from the webinar are most suited for that days trading. If one can do that successfully (which is not easy), I think that is half the battle.

Not taking a trade is better than a bad trade.

My opinion is that there are 3 main types of trading days.

  1. Most common is two sided trading action with swings up and down – this type of trading day is most suitable for the main aspect of this model, which is taking trades based on the arrows.
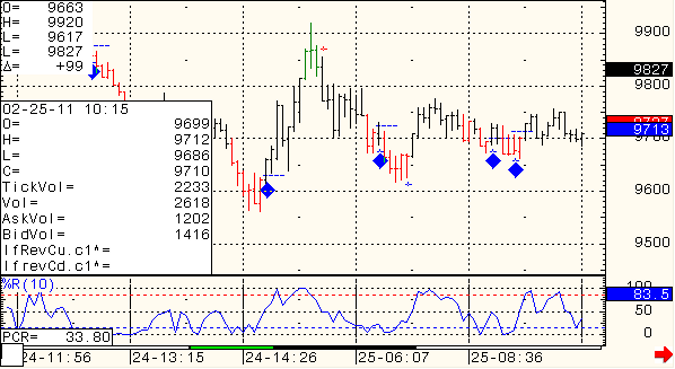
  2. Strong trending day, mostly one directional – this type of trading day is the least common, many times this will happen on Mondays and maybe 3-5 times a month at most – this type of trading day is most suitable for using the color scheme I have on the charts. Green bars mean strong up trend, red bars mean strong down trend. If you determined that this is a trend day, then use pull backs to enter with the direction of trend and use the parabolic (little dashes) as you trailing stop.
  3. Slow and/ or choppy trading day – this type of trading day is best suited for taking small profits from the market by either using the main model or taking the diamonds as entry signal, and going for quick profits and tight stops.

Read the rest of this entry »


Futures Trading Levels Feb 28th and Crude Oil Futures Chart

February 26th, 2011 Filed under Crude Oil, Futures Trading | Comment (0)

Cannon Trading / E-Futures.com

Wishing you all a great weekend. Amazing how fast short February went by and Monday will be the last trading day of the month.

I expect the higher volatility we have seen over the last few days to stay with us for a while….so as mentioned before be aware of it, adjust your trading parameters accordingly and stay disciplined!

Below you will see a screen shot from the crude oil futures chart I share intraday. We also execute this crude day-trading system in-house as an “auto traded ” trading system with letter of direction.

The day-trading system is up slightly more than $1,000 NET per contract traded since we launched live trading on Jan. 28th 2011.*
*These are risky markets and only risk capital should be used.

Past performances are not necessarily indicative of future results.
If you are interested in more information, would like to see detailed LIVE results, please send me an email or speak with your broker.

Daily E-Mini S&P 500 Futures Trading Chart

Stock futures trading chart levels Read the rest of this entry »


Futures Trading Levels and Day Trading Environment

February 25th, 2011 Filed under Futures Trading | Comment (0)

Cannon Trading / E-Futures.com

Another strong volume day on the SP 500, with price action going both ways intraday but still finishing lower for the day.

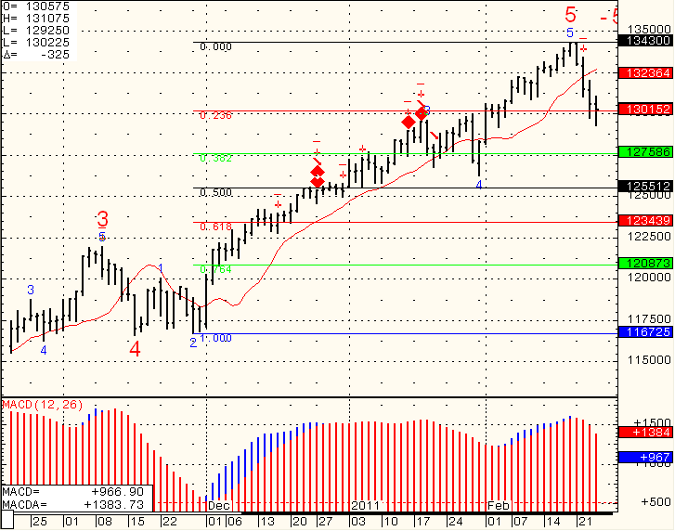
Some longer term FIB levels below to watch for. Middle East and crude oil will lead the way as we head into the weekend.

As volatility rises, so does risk…..as well as intraday opportunities. make sure you understand the change in the day trading environment we are noticing the last few days and incorporate into your trading decisions and money management.

Daily E-Mini S&P 500 Futures Trading Chart

Stock futures trading chart levels Read the rest of this entry »

Have A Questions? Open an account Free Demo Account Free Demo Account

Question?

Valid first name is required.
Valid last name is required.
Phone number is required.
E-mail is required.
Message is required.
Phone (USA)
Phone (International)
Our Approach

You and your broker will work together to achieve your trading goals. We develop long term relationships with our clients so that we can grow and improve together.
Learn More About Choosing Cannon

Our Platforms

Please click on one of our platforms below to learn more about them, start a free demo, or open an account.
E-Futures Sierra Charts Firetip (Mac Compatible) RTrader

________
Doing Business With
See more...
Loading
Loading

Loading