Gold Futures Trading

Gold Futures Trading


Crude Oil and Gold Futures Chart, Futures Levels and Economic Reports 2.12.2013

February 11th, 2014 Filed under Commodity Trading, Future Trading News, Futures Trading | Comments Off on Crude Oil and Gold Futures Chart, Futures Levels and Economic Reports 2.12.2013

Connect with Us! Use Our Futures Trading Levels and Economic Reports RSS Feed.

Like us on FacebookFollow us on TwitterView our profile on LinkedInFind us on Google+Cannon Trading Futures Trading Resistance & Support Levels and Economic ReportsFind us on Yelp

1. Market Commentary
2. Futures Support and Resistance Levels – S&P, Nasdaq, Dow Jones, Russell 2000, Dollar Index
3. Commodities Support and Resistance Levels – Gold, Euro, Crude Oil, T-Bonds
4. Commodities Support and Resistance Levels – Corn, Wheat, Beans, Silver
5. Futures Economic Reports for Wednesday February 12, 2014

Hello Traders,

For 2014 I would like to wish all of you discipline and patience in your trading!


Trader Planet


Voted Best Blog 2013 by Trader Planet

Thanks everyone who voted!! Appreciate your help in winning the #1 blog for futures trading by Trader Planet!! Please feel free to forward our daily blog to friends and other fellow traders who might be interested.

Another two markets I like to touch on when it comes to “other markets to daytrade beside the mini SP 500” are crude Oil and Gold futures.

More than a few similarities between the two markets.

They are both volatile, can move VERY fast. I have seen some very large moves happen in matter of minutes if not seconds. The “fear & greed” factor really plays a role in these specific two markets.

Both have active trading hours starting with Far East trading around 10 PM est all the way to the next morning until about 3 PM est. Good volume generally speaking but not close to the mini SP or ten year notes. So you may see some slippage on stops but the volume is more than enough to trade size.

Each tick on gold is $10, so every dollar move =$100 against you or in your favor. Crude is similar, each tick = $10. One full $1 move = $1000.

Both markets were quiet today relatively speaking but even on a quiet day, the range on gold was  $21 or = $2100 wide using one futures contract. Crude ranges today was less than $1 or about $890 between hi/lo.

I like using overbought/ oversold indicators on the two markets as well as using range / Renko charts.

If you never traded these markets before, I highly recommend exploring in simulation/ demo mode. get a feel for the explosiveness, volatility, personality for a few weeks before trying in live mode.

As always, any questions, please feel free to email me.

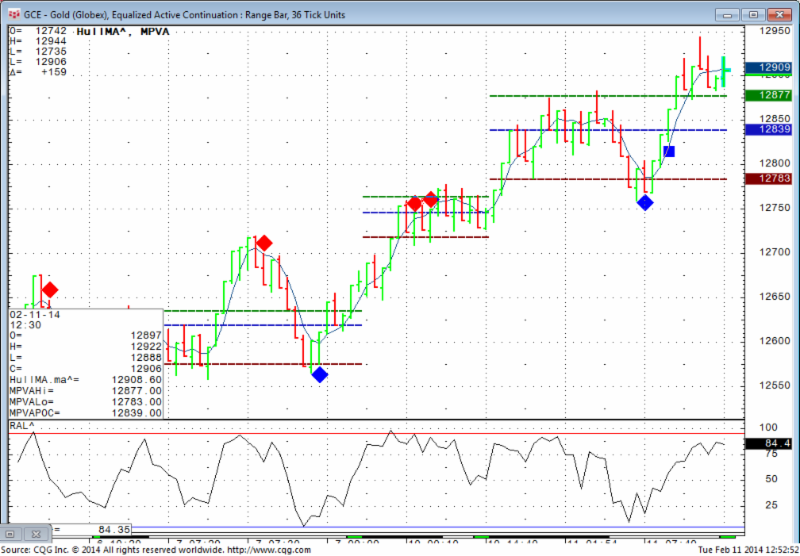
Two charts from today’s session of gold and crude for your review below ( if you like to try the charts I am using along with indicators displayed, send me an email):


Crude 18 ticks range bar Feb. 11th 2014

CLE - Crude Lights (Globex), Equalized Active Continuation - Range Bar 18 Ticks Units

Gold, 36 ticks range bar Feb. 11th 2014
 

GCE - Gold (Globex), Equalized Active Continuation - Range Bar =, 18 Ticks Units

GCE – Gold (Globex), Equalized Active Continuation – Range Bar =, 18 Ticks Units

Read the rest of this entry »


Gold Daily & Trading Levels & Economic Reports 11.13.2013

November 12th, 2013 Filed under Commodity Trading, Future Trading News, Futures Trading, Metal Futures | Comments Off on Gold Daily & Trading Levels & Economic Reports 11.13.2013

Connect with Us! Use Our Futures Trading Levels and Economic Reports RSS Feed.

Like us on FacebookFollow us on TwitterView our profile on LinkedInFind us on Google+Cannon Trading Futures Trading Resistance & Support Levels and Economic ReportsFind us on Yelp

1. Market Commentary
2. Futures Support and Resistance Levels – S&P, Nasdaq, Dow Jones, Russell 2000, Dollar Index
3. Commodities Support and Resistance Levels – Gold, Euro, Crude Oil, T-Bonds
4. Commodities Support and Resistance Levels – Corn, Wheat, Beans, Silver
5. Futures Economic Reports for Wednesday November 13, 2013

Hello Traders,

For 2013 I would like to wish all of you discipline and patience in your trading! 

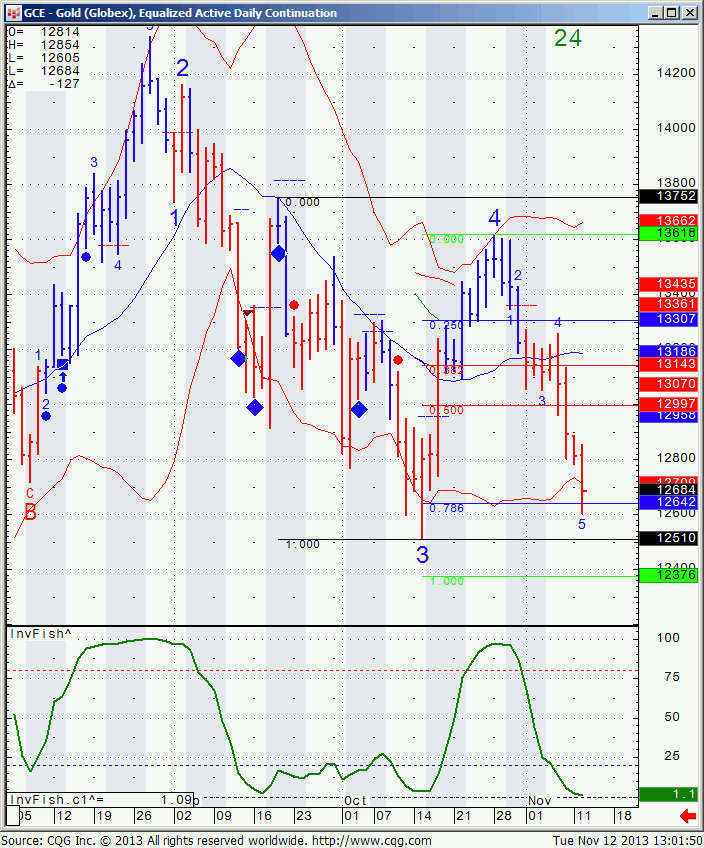
Gold and Silver took a hit today, selling off 1% and 2.5% respectively.

Gold and silver are much different markets in my opinion than mini SP or us tbonds for example. Gold, silver and crude oil for that matter are quite volatile with fear and greed playing a bigger role than in other markets. I have seen these markets make some very large moves intraday at times.

I do think that both gold and crude oil are GOOD markets to observe as potential for day-trading as long as you use stops…if you are a trader that “uses mental stops” , these markets are not for you…Good news is that both crude and gold have a mini contract .

Gold chart for your review below with some possible levels to watch for:

GCE - Gold (Globex), Equalized Active Daily Continuation

GCE – Gold (Globex), Equalized Active Daily Continuation

Read the rest of this entry »


Futures Trading Levels and Economic Reports for August 13, 2013

August 12th, 2013 Filed under Future Trading News | Comments Off on Futures Trading Levels and Economic Reports for August 13, 2013

Connect with Us! Use Our Futures Trading Levels and Economic Reports RSS Feed.

Like us on FacebookFollow us on TwitterView our profile on LinkedInFind us on Google+Cannon Trading Futures Trading Resistance & Support Levels and Economic ReportsFind us on Yelp

1. Market Commentary
2. Futures Support and Resistance Levels – S&P, Nasdaq, Dow Jones, Russell 2000, Dollar Index
3. Commodities Support and Resistance Levels – Gold, Euro, Crude Oil, T-Bonds
4. Commodities Support and Resistance Levels – Corn, Wheat, Beans, Silver
5. Futures Economic Reports for Tuesday August 13, 2013

Hello Traders,

For 2013 I would like to wish all of you discipline and patience in your trading! 

Another slow, summer trading day to start the week in the stock index futures segment. Be careful of this type of trading days. The low volume and narrow ranges can get you too comfortable to trading sloppy….

Sometimes no trade is better than a bad trade. Actually all the time…

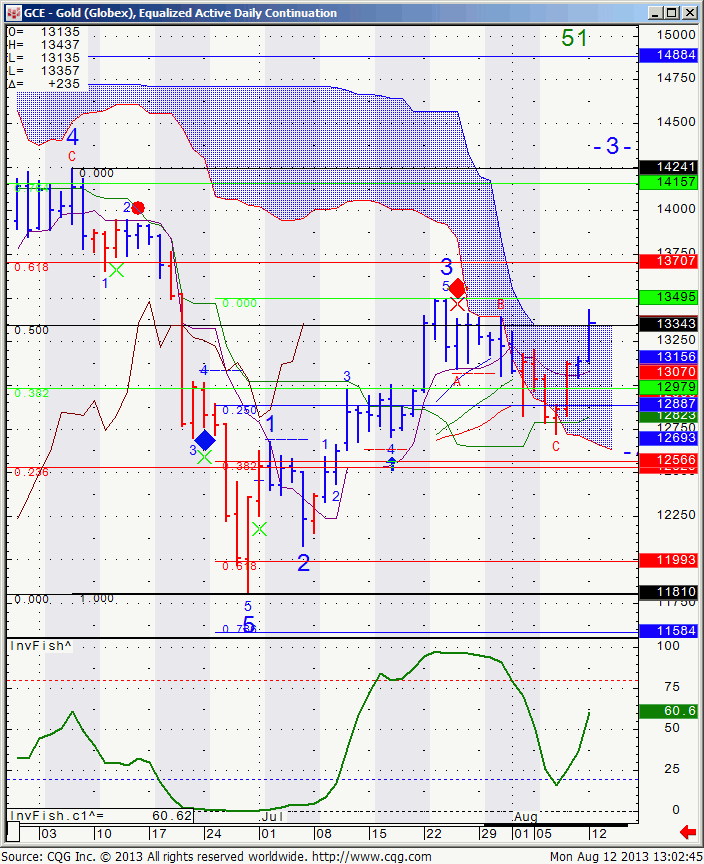
In between gold futures had a nice up move over the last few sessions. Daily chart of Dec. Gold futures for your review below.

Notice that prices closed ABOVE the IMOKU cloud, which is usually a bullish sign. Market needs to confirm this bullish sign by closing above 1349.5.

Gold Futures Daily Chart

Gold Futures Daily Chart

Read the rest of this entry »

Have A Questions? Open an account Free Demo Account Free Demo Account

Question?

Valid first name is required.
Valid last name is required.
Phone number is required.
E-mail is required.
Message is required.
Phone (USA)
Phone (International)
Our Approach

You and your broker will work together to achieve your trading goals. We develop long term relationships with our clients so that we can grow and improve together.
Learn More About Choosing Cannon

Our Platforms

Please click on one of our platforms below to learn more about them, start a free demo, or open an account.
E-Futures Sierra Charts Firetip (Mac Compatible) RTrader

________
Doing Business With
See more...
Loading
Loading

Loading