mini SP 500

mini SP 500


Futures Levels and Economic Reports 7.24.2014

July 23rd, 2014 Filed under Crude Oil, Future Trading News, Futures Trading, Indices | Comment (0)

Connect with Us! Use Our Futures Trading Levels and Economic Reports RSS Feed.

Like us on FacebookFollow us on TwitterView our profile on LinkedInFind us on Google+Cannon Trading Futures Trading Resistance & Support Levels and Economic ReportsFind us on Yelp

1. Market Commentary
2. Futures Support and Resistance Levels – S&P, Nasdaq, Dow Jones, Russell 2000, Dollar Index
3. Commodities Support and Resistance Levels – Gold, Euro, Crude Oil, T-Bonds
4. Commodities Support and Resistance Levels – Corn, Wheat, Beans, Silver
5. Futures Economic Reports for Thursday July 24, 2014

Hello Traders,

For 2014 I would like to wish all of you discipline and patience in your trading!

Getting Clues from other markets?

When day trading a specific market do you only look at the chart for that specific market? Maybe you took it a step further and you are viewing multiple time frame charts for the same market which is a good step in my eyes.

Now lets take this even one step further by observing what markets have correlation, direct or inverse to the market you are trading, perhaps this can help you make decisions when trading.

I will give a few examples from my experience:

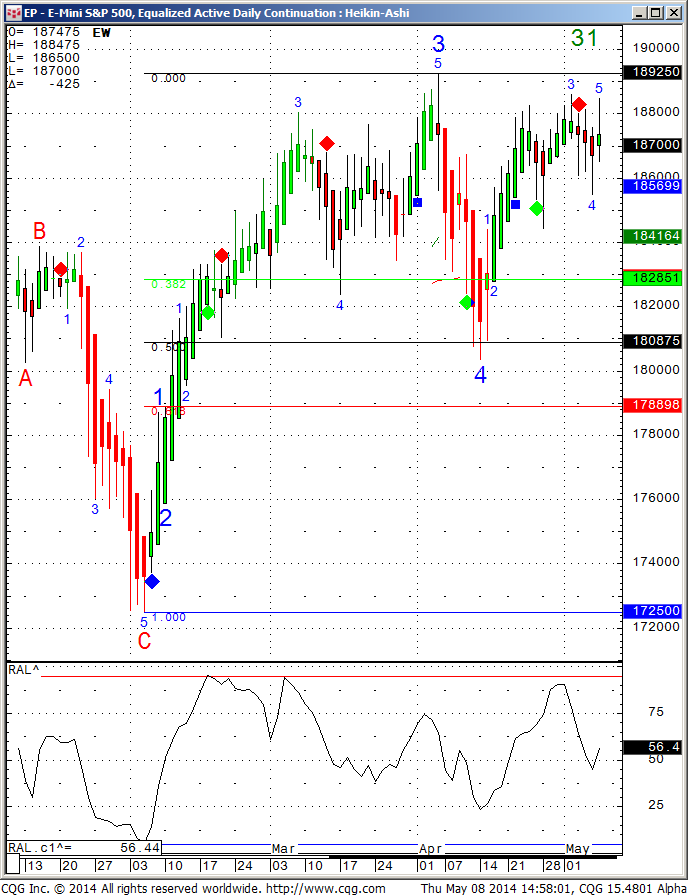
When I am in a position in the mini SP 500, I will often observe what the bonds are doing ( many times inverse correlation), I will take notice of what the Dow, Russell and NASDAQ are doing as well ( direct correlation).

If I am trading crude oil, I will many times pay attention to what unleaded gas and heating oil are doing (very close, although not direct correlation) as well as what WTI crude is doing.

One more example may be when I have a position trade in beans and I will try to get a feel for the overall direction of the grain markets (is there a trend? are they sideways?) by looking at corn, wheat in general and then look to see what bean oil and soy meal which are by products of beans are doing.

One question that can be asked is “what do you mean observe this or that market”? and a good example will be:

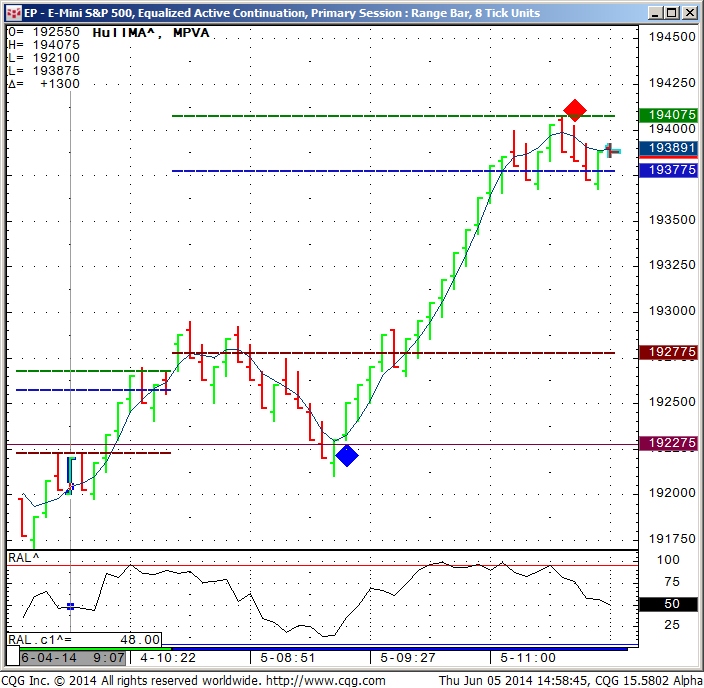
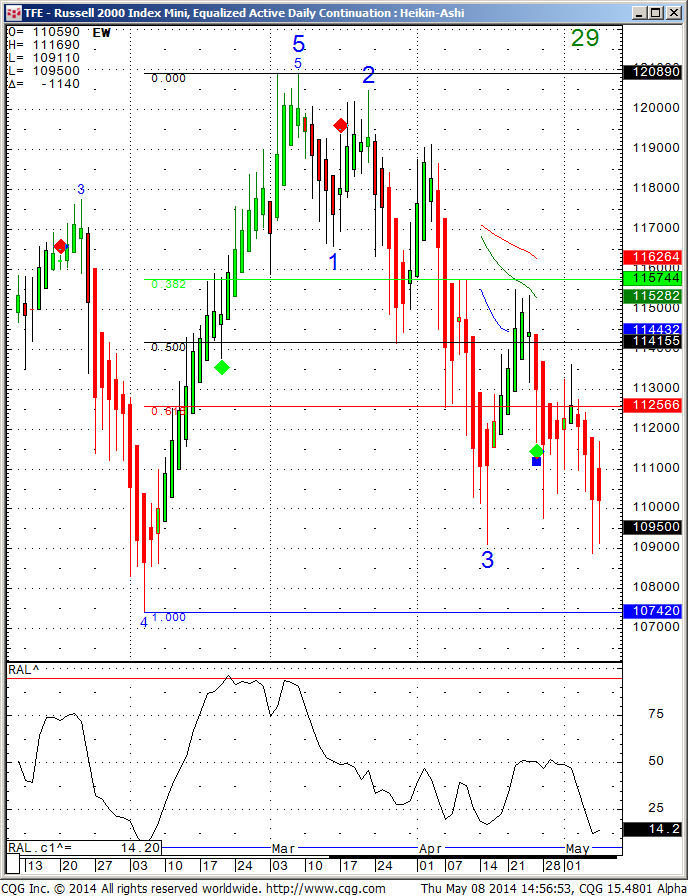
Lets say I am short the mini SP 500 and I am not sure if to take profit or not. I look at the mini Russell and see that mini Russell just made new lows, that will give me more confidence to stay in my short position as I feel there might be more room to the downside.

Read the rest of this entry »


Futures Levels & Economic Reports 7.09.2014

July 8th, 2014 Filed under Commodity Brokers, Index Futures | Comment (0)

Connect with Us! Use Our Futures Trading Levels and Economic Reports RSS Feed.

Like us on FacebookFollow us on TwitterView our profile on LinkedInFind us on Google+Cannon Trading Futures Trading Resistance & Support Levels and Economic ReportsFind us on Yelp

1. Market Commentary
2. Futures Support and Resistance Levels – S&P, Nasdaq, Dow Jones, Russell 2000, Dollar Index
3. Commodities Support and Resistance Levels – Gold, Euro, Crude Oil, T-Bonds
4. Commodities Support and Resistance Levels – Corn, Wheat, Beans, Silver
5. Futures Economic Reports for Wednesday July 9, 2014

Hello Traders,

For 2014 I would like to wish all of you discipline and patience in your trading!

I am not sure if it is the overbought conditions stock index futures are in, perhaps fear of the start of earning season or maybe it is the tense situation over in Israel/ Middle East – but the result today was one of the more meaningful down days of the last few months along with above avg. volume.


Not sure it is anything more than normal market action after indices made all time highs last week….I am a little more skeptic now days when it comes to the short side of the indices. That been said, if September SP500 can break below 1952 ( just a bit below today’s lows) I think we have higher chances of a continuation lower.

In between, know what time frame you are trading, know your rules, your objectives, accept the fact that you will have good and bad trading days and measure your progress after you define what it is.


Mini S&P Charts & Economic Reports 6.06.2014

June 5th, 2014 Filed under Future Trading News | Comment (0)

Connect with Us! Use Our Futures Trading Levels and Economic Reports RSS Feed.

Like us on FacebookFollow us on TwitterView our profile on LinkedInFind us on Google+Cannon Trading Futures Trading Resistance & Support Levels and Economic ReportsFind us on Yelp

1. Market Commentary
2. Futures Support and Resistance Levels – S&P, Nasdaq, Dow Jones, Russell 2000, Dollar Index
3. Commodities Support and Resistance Levels – Gold, Euro, Crude Oil, T-Bonds
4. Commodities Support and Resistance Levels – Corn, Wheat, Beans, Silver
5. Futures Economic Reports for Friday June 6, 2014

Hello Traders,

For 2014 I would like to wish all of you discipline and patience in your trading!


I was talking about how volatility comes and goes in cycles yesterday and sure enough after ECB decision to lower rates, we saw some good, two sided trading action in stock indices along with much better volume.

More to come tomorrow in my opinion as market awaits monthly unemployment report before the cash opens ( 5:30 AM pacific time/ 7:30 AM Central time)

I must share with you my mini SP chart set up as it played out today which shows the only two signals for today  -1 buy and 1 sell ( blue diamond buy, red diamond sell). To keep this balanced I am also sharing a screen shot from a few trading days ago where two of the red diamonds generated a “failed” sell signal.

If you like a trial for the ALGO, please read below the charts:

Today’s session:


May 21st 2014 session:


Would you like to have access to my DIAMOND and TOPAZ ALGOs as shown above

and be able to apply for any market and any time frame on your own PC ?   You can now have a three weeks free trial where I enable the ALGO along with few studies for your own sierra/ ATcharts and/or CQG .


To start your trial, please visit:


If so, please send me an email with the following information:


1. Are you currently trading futures?

2. Charting software you use?

3. If you use sierra or ATcharts, please let me know the user name so I can enable you

4. Markets you currently trading?


HYPOTHETICAL PERFORMANCE RESULTS HAVE MANY INHERENT LIMITATIONS, SOME OF WHICH ARE DESCRIBED BELOW.  NO REPRESENTATION IS BEING MADE THAT ANY ACCOUNT WILL OR IS LIKELY TO ACHIEVE PROFITS OR LOSSES SIMILAR TO THOSE SHOWN.  IN FACT, THERE ARE FREQUENTLY SHARP DIFFERENCES BETWEEN HYPOTHETICAL PERFORMANCE RESULTS AND THE ACTUAL RESULTS SUBSEQUENTLY ACHIEVED BY ANY PARTICULAR TRADING PROGRAM.


ONE OF THE LIMITATIONS OF HYPOTHETICAL PERFORMANCE RESULTS IS THAT THEY ARE GENERALLY PREPARED WITH THE BENEFIT OF HINDSIGHT.  IN ADDITION, HYPOTHETICAL TRADING DOES NO INVOLVE FINANCIAL RISK, AND NO HYPOTHETICAL TRADING RECORD CAN COMPLETELY ACCOUNT FOR THE IMPACT OF FINANCIAL RISK IN ACTUAL TRADING.  FOR EXAMPLE, THE ABILITY TO WITHSTAND LOSSES OR TO ADHERE TO A PARTICULAR TRADING PROGRAM IN SPITE OF TRADING LOSSES ARE MATERIAL POINTS WHICH CAN ALSO ADVERSELY AFFECT ACTUAL TRADING RESULTS.  THERE ARE NUMEROUS OTHER FACTORS RELATED TO THE MARKETS IN GENERAL OR TO THE IMPLEMENTATION OF ANY SPECIFIC TRADING PROGRAM WHICH CANNOT BE FULLY ACCOUNTED FOR IN THE PREPARATION OF HYPOTHETICAL PERFORMANCE RESULTS AND ALL OF WHICH CAN ADVERSELY AFFECT ACTUAL TRADING RESULTS


If you like the information we share? We would appreciate your positive reviews on our new yelp!! Read the rest of this entry »


Futures Relationships between the Mini S&P and Mini Russell 2000 5.15.2014

May 14th, 2014 Filed under Future Trading News | Comment (0)

Connect with Us! Use Our Futures Trading Levels and Economic Reports RSS Feed.

Like us on FacebookFollow us on TwitterView our profile on LinkedInFind us on Google+Cannon Trading Futures Trading Resistance & Support Levels and Economic ReportsFind us on Yelp

1. Market Commentary
2. Futures Support and Resistance Levels – S&P, Nasdaq, Dow Jones, Russell 2000, Dollar Index
3. Commodities Support and Resistance Levels – Gold, Euro, Crude Oil, T-Bonds
4. Commodities Support and Resistance Levels – Corn, Wheat, Beans, Silver
5. Futures Economic Reports for Thursday May 15, 2014

Hello Traders,

For 2014 I would like to wish all of you discipline and patience in your trading!


I wrote a quick paragraph about observing the relationship between the mini Russell 2000 and the mini SP 500 yesterday and I got a response from one of our readers that I thought is worth sharing and has some good observations, so here is below with very minor edits:


Hi Ilan,


I received your comments about Russell leading SP’s in tonight’s email, and as someone who has been watching and studying this relationship for over 5 years, I wanted to make a few comments.


Russell 2000 does tend to lead other Indexes on larger time frames like daily and larger intra-day charts like 30 min and higher. However nothing is a simple as it seems of course. And one of the biggest reasons it is not simple is because large traders and institutions know that small traders are trying to get clues from TF to trade ES, and I have seen many times where they will come in and start buying Russell and a few minutes

later start selling much larger size in ES.
Also, quite often these two Indexes will trade without any correlation at all shorter term, not sure if you saw closing minutes of Monday’s trading where TF dropped 7 points in a few minutes and ES did not budge. And then there is a matter of difference in liquidity of course, sometimes I see quite opposite take place – where ES starts moving and TF is sitting there, and it’s not until ES moved two whole points does TF starts to move a little, this happens because TF buyer will have to give up a lot of edge to buy any kind of size, and they need to see a decent move in ES before they will buy TF.


What I described above is a very small example of what happens between these two Indexes, it is important to understand that what seems to be correlation short term, in access of 80% of the time will not produce desired results. With that said….there are instances when TF’s lead is obvious, but it takes quite a bit of time to learn and understand mechanics behind it, I am afraid comparing two intra-day charts will not shed any light on this relationship, there is too much more going behind “the scenes”


Sincerely,

Simon B.


If you like the information we share? We would appreciate your positive reviews on our new yelp!! Read the rest of this entry »


Mini Russell & Mini S&P Heikin Ashi Charts & Economic Reports 5.09.2014

May 8th, 2014 Filed under Future Trading News | Comment (0)

Connect with Us! Use Our Futures Trading Levels and Economic Reports RSS Feed.

Like us on FacebookFollow us on TwitterView our profile on LinkedInFind us on Google+Cannon Trading Futures Trading Resistance & Support Levels and Economic ReportsFind us on Yelp

1. Market Commentary
2. Futures Support and Resistance Levels – S&P, Nasdaq, Dow Jones, Russell 2000, Dollar Index
3. Commodities Support and Resistance Levels – Gold, Euro, Crude Oil, T-Bonds
4. Commodities Support and Resistance Levels – Corn, Wheat, Beans, Silver
5. Futures Economic Reports for Friday May 9, 2014

Hello Traders,

For 2014 I would like to wish all of you discipline and patience in your trading!


Seems like both the NASDAQ and the Russell had a healthy correction over the past 8 weeks while both the Dow and the SP500 are still flirting with the all time highs. The big question is who going to catch up with who…NASDAQ and Russell starts edging higher or SP and Dow start going lower?


Daily charts of the mini Russell 2000 as well as the mini SP 500 for your review below:


If you like the information we share? We would appreciate your positive reviews on our new yelp!! Read the rest of this entry »

Have A Questions? Open an account Free Demo Account Free Demo Account

Question?

Valid first name is required.
Valid last name is required.
Phone number is required.
E-mail is required.
Message is required.
Phone (USA)
Phone (International)
Our Approach

You and your broker will work together to achieve your trading goals. We develop long term relationships with our clients so that we can grow and improve together.
Learn More About Choosing Cannon

Our Platforms

Please click on one of our platforms below to learn more about them, start a free demo, or open an account.
E-Futures Sierra Charts Firetip (Mac Compatible) RTrader

________
Doing Business With
See more...
Loading
Loading

Loading