Support and Resistance Levels

Support and Resistance Levels


Try trading indicators for free!

November 14th, 2016 Filed under Commodity Brokers, Commodity Trading, Crude Oil, Day Trading, Day Trading Webinar | Comment (0)

Connect with Us! Use Our Futures Trading Levels and Economic Reports RSS Feed.

Like us on FacebookFollow us on TwitterView our profile on LinkedInFind us on Google+Cannon Trading Futures Trading Resistance & Support Levels and Economic ReportsFind us on Yelp

1. Market Commentary
2. Futures Support and Resistance Levels – S&P, Nasdaq, Dow Jones, Russell 2000, Dollar Index
3. Commodities Support and Resistance Levels – Gold, Euro, Crude Oil, T-Bonds
4. Commodities Support and Resistance Levels – Corn, Wheat, Beans, Silver
5. Futures Economic Reports for Friday November 11, 2016

Greetings!

Would you like to try trading indicators NOT found anywhere else?

If so check out https://www.cannontrading.com/tools/intraday-futures-trading-signals

Read the rest of this entry »


Support and Resistance Levels 10.13.2016

October 12th, 2016 Filed under Future Trading News | Comment (0)

Connect with Us! Use Our Futures Trading Levels and Economic Reports RSS Feed.

Like us on FacebookFollow us on TwitterView our profile on LinkedInFind us on Google+Cannon Trading Futures Trading Resistance & Support Levels and Economic ReportsFind us on Yelp

1. Market Commentary
2. Futures Support and Resistance Levels – S&P, Nasdaq, Dow Jones, Russell 2000, Dollar Index
3. Commodities Support and Resistance Levels – Gold, Euro, Crude Oil, T-Bonds
4. Commodities Support and Resistance Levels – Corn, Wheat, Beans, Silver
5. Futures Economic Reports for Thursday October 13, 2016

Greetings!

There will be no market commentary today.

Read the rest of this entry »


Using Range Bar and Volume Charts for Scalping 7-20-2016

July 19th, 2016 Filed under Future Trading News, Futures Trading, Trading Guide | Comment (0)

Connect with Us! Use Our Futures Trading Levels and Economic Reports RSS Feed.

Like us on FacebookFollow us on TwitterView our profile on LinkedInFind us on Google+Cannon Trading Futures Trading Resistance & Support Levels and Economic ReportsFind us on Yelp

1. Market Commentary
2. Futures Support and Resistance Levels – S&P, Nasdaq, Dow Jones, Russell 2000, Dollar Index
3. Commodities Support and Resistance Levels – Gold, Euro, Crude Oil, T-Bonds
4. Commodities Support and Resistance Levels – Corn, Wheat, Beans, Silver
5. Futures Economic Reports for Wedneday July 20, 2016

Hello Traders,

Why I Like to Use Tick and Volume Charts for Scalping

Today, I decided to touch more on an educational feature rather than provide a certain market outlook.

Many of my clients and blog readers know that when it comes to short-term trading I am a fan of using volume charts, tick charts, range bar charts and Renko charts rather than the traditional time charts like the 1 minutes, 5 minutes etc.

My rule of thumb is that if you as a trader who makes decisions based on charts that are less than 15 minutes time frame, it may be worth your time to research, back test and do some homework as to potentially using other type of charts like volume charts, Range charts etc.

Volume charts will draw a new bar once a user defined number of contracts traded. An example is the mini SP 10,000 volume chart which will draw a new bar once 10,000 contracts are traded.

Range bar charts will draw new charts once price action has exceeded a user’s pre-defined price or ticks range. An example might be an 18 ticks range bar chart on crude oil.

While volume charts rely ONLY on volume, the range bar charts rely ONLY on price action.

Their main advantage over traditional time charts is twofold in my opinion:

If the market is moving fast, reports have come out or there is heavy volume in the market, the traditional 5 minute chart will need 5 minutes to complete the next bar before it provides you with a signal…if you have day traded futures before you know what 5 minutes can do to these markets….The volume charts or range bar charts in this case will complete the bars MUCH faster because there is strong price action and strong volume and will be able to provide a signal faster than the time charts. Read the rest of this entry »


SP chart +Support and resistance levels for 7.19.2016

July 18th, 2016 Filed under Future Trading News | Comment (0)

Connect with Us! Use Our Futures Trading Levels and Economic Reports RSS Feed.

Like us on FacebookFollow us on TwitterView our profile on LinkedInFind us on Google+Cannon Trading Futures Trading Resistance & Support Levels and Economic ReportsFind us on Yelp

1. Market Commentary
2. Futures Support and Resistance Levels – S&P, Nasdaq, Dow Jones, Russell 2000, Dollar Index
3. Commodities Support and Resistance Levels – Gold, Euro, Crude Oil, T-Bonds
4. Commodities Support and Resistance Levels – Corn, Wheat, Beans, Silver
5. Futures Economic Reports for Tuesday July 19, 2016

Hello Traders,

It is Earnings season. If you are a stock index trader, make sure you know which important earnings are coming out and when.

Visit this page, scroll down to bottom to see today’s earnings:

http://www.reuters.com/finance/EarningsUS

On a different note, it feels like somewhat of “Summer Trading” – Low energy and lower “speed” in the markets. I would have expected to see much more volatility after the news from Turkey but the market for now has not paid much attention. Volume was relatively low today and the range of moves was relatively tight.

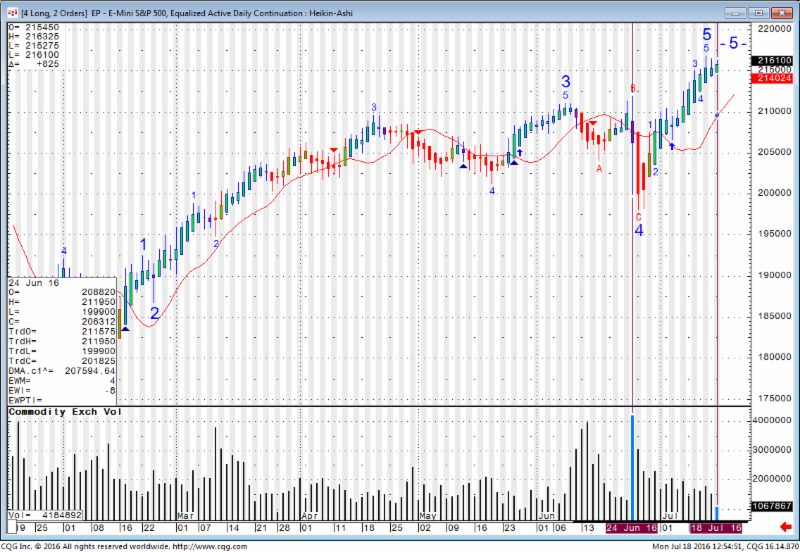
Looking at the mini SP 500 chart along with volume as markets make new highs leads me to believe it is somewhat artificial….but then again it is not wise to argue with price action  and I would rather get a signal correction is starting than trying to predict the correction.

 Mini SP 500 Chart

Read the rest of this entry »


Mini Russell 2000 Chat & Futures Trading Levels 4.14.2014

April 14th, 2014 Filed under Commodity Trading, Future Trading News, Futures Trading, Index Futures | Comment (0)

Connect with Us! Use Our Futures Trading Levels and Economic Reports RSS Feed.

Like us on FacebookFollow us on TwitterView our profile on LinkedInFind us on Google+Cannon Trading Futures Trading Resistance & Support Levels and Economic ReportsFind us on Yelp

1. Market Commentary
2. Futures Support and Resistance Levels – S&P, Nasdaq, Dow Jones, Russell 2000, Dollar Index
3. Commodities Support and Resistance Levels – Gold, Euro, Crude Oil, T-Bonds
4. Commodities Support and Resistance Levels – Corn, Wheat, Beans, Silver
5. Futures Economic Reports for Tuesday April 15, 2014

Hello Traders,

For 2014 I would like to wish all of you discipline and patience in your trading!

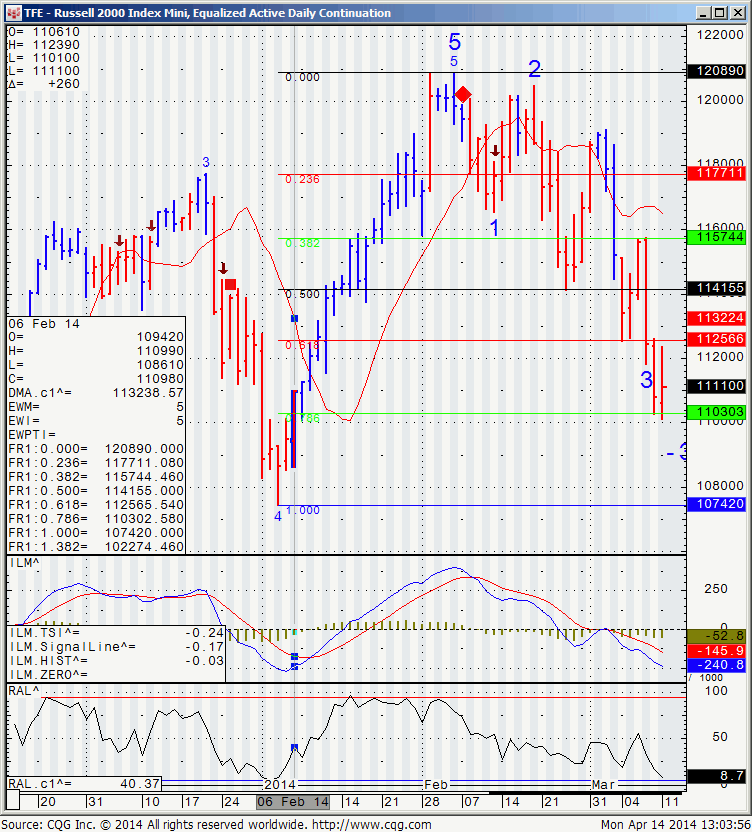
Mini Russell daily chart for your review below.

TFE - Russell 200 Index Mini, Equalized Active Daily Continuation

TFE – Russell 200 Index Mini, Equalized Active Daily Continuation

Have A Questions? Open an account Free Demo Account Free Demo Account

Question?

Valid first name is required.
Valid last name is required.
Phone number is required.
E-mail is required.
Message is required.
Phone (USA)
Phone (International)
Our Approach

You and your broker will work together to achieve your trading goals. We develop long term relationships with our clients so that we can grow and improve together.
Learn More About Choosing Cannon

Our Platforms

Please click on one of our platforms below to learn more about them, start a free demo, or open an account.
E-Futures Sierra Charts Firetip (Mac Compatible) RTrader

________
Doing Business With
See more...
Loading
Loading

Loading