VolSys®
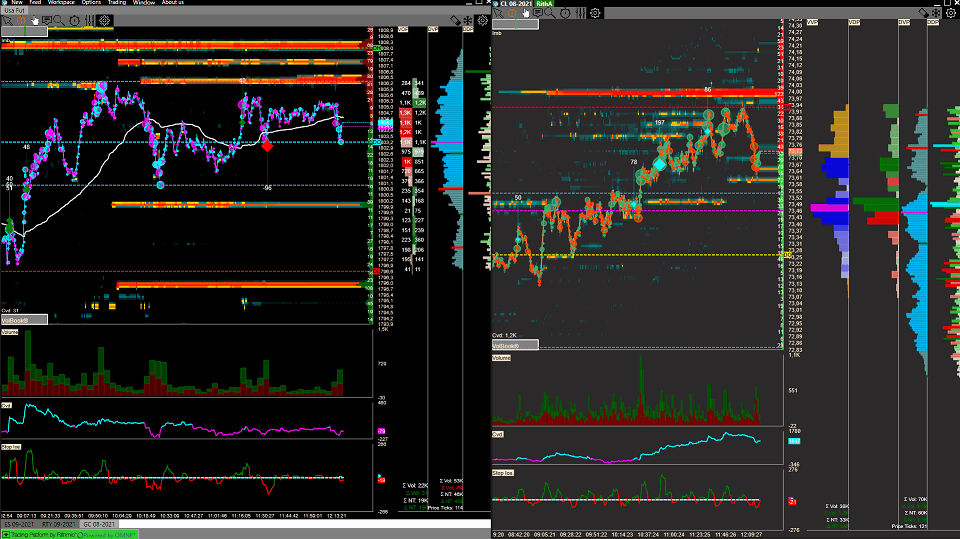
VolSys® is a professional trading platform which its main goal is the analysis of the volume profiles, time and sales, order flow and footprint. We have also developed many proprietary indicators based on our experience on the market and our partner traders.
Volume Profile
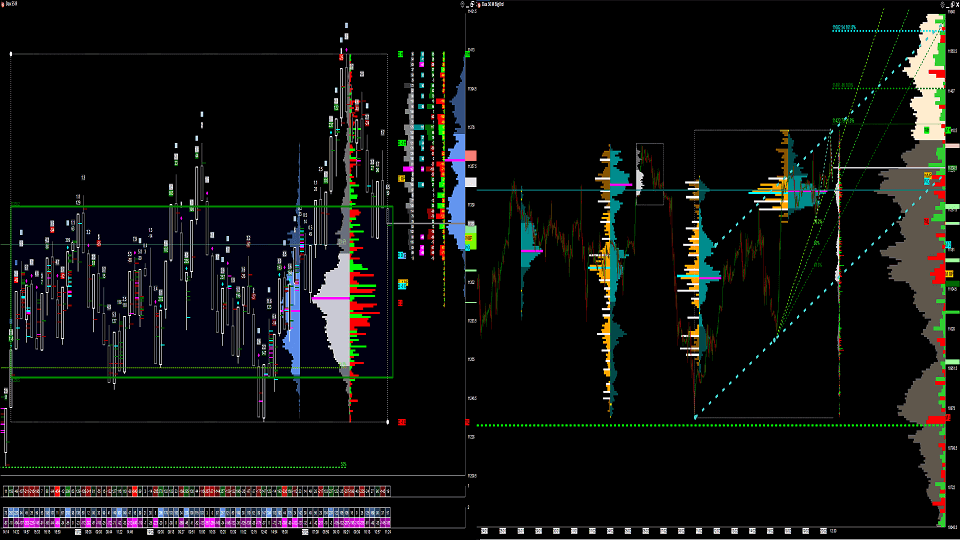
Volume profile is one of the most powefull volume indicators becuase it highlights the most interested zone of price and how they were executed thanks to the delta profile.
The abilty to read the profile is one of the most important key for a successfully market analysis with the volume and it is also not so easy, because when we see a profile, you should be also to identify the shape of the distribution, unbalanced zones, pseudo point of control(POC) and many other things.
VolSys®, in addition to the common visualization way like session, composite, visible and so on and with volume, bid/ ask, delta profile, offers an innovative way of visualization thanks to an automatic tick grouping of delta profile for identify immediatly the aborption and pressure zone; we also offer the possibily to build a pseudo profile for the analysis of long term period such as ten or more years.
Order Flow Analyzer
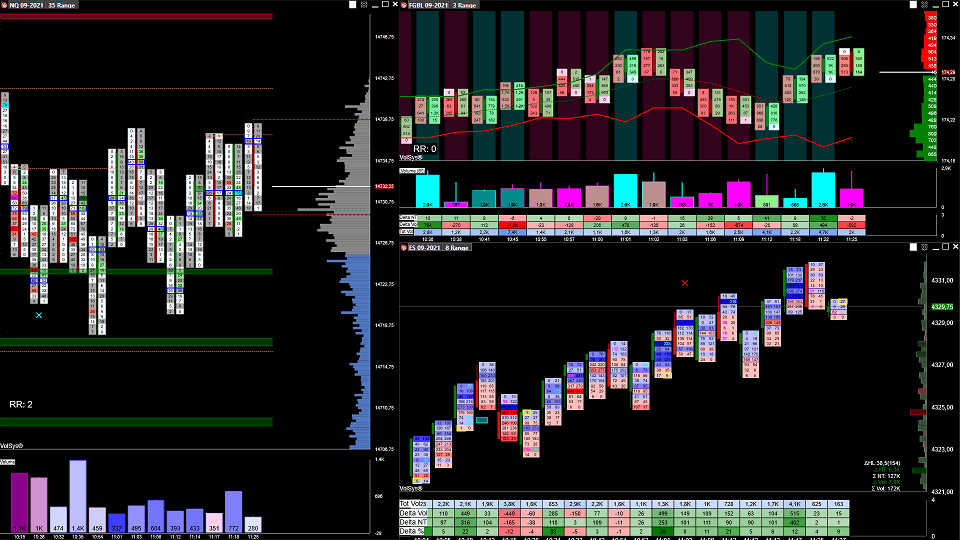
Order flow analyzer, which is also known as Footprint®, is an other very important indicator in volume analysis because you combine price, volume and order flow(time and sales) in a single bar. It helps trader to identify potential support and resistence zone, buyers/seller acceleration, absorption, exhaustion, traped and many other market actions.
This indicator is fully customisable since you can disply total Volume, delta Volume or bid/ask Split Volume with the possibilty to color background and text based on several condition such as delta or imbalance with automatic or user defined filter
We have made a huge effort to develop automatic algorithm for the auto calcualtion of various range with a very good results for the most of instruments.
Long Term Continuos Chart
One of the common problem with the futures is the expiration of the contracts, which doesn’t allows user to make a long term analysis, but also a short term in the period near to the rollover; VolSys® automatically detects rollover window, highlighting symbols which the volume are already on the next contract month.
The platform also builds long-term continuos chart with automatic contracts merging based on technical expiration or volume rules with back-adjusted prices
Charts

- Time, Range X, Volume, OrderFlow and VolSys ® charts
- Clustering of data. Each bar can be viewed “from the inside” (it can be seen what volumes, bids, asks, deltas were on each price of the given bar).
- Linked object charts In any chart, you can easily view graphic objects such as trend lines, retracements, fan lines and more, of any other chart in the workspace
- Display of large market spikes in the chart. It is possible to create any number of filters for orders which will be displayed in the charts. (BigTrades Indicator)
- Automatic grouping of the ticks that make up the Volume Profile and the OrderFlowBars, for an immediate and intelligent visualization of Big Players interest points
- Bar chart of volumes with the possibility to choose initial and finite interval (display options: Volume, Trades, Bid-Ask, Delta, Icebergs).
- A whole range of innovative indicators allowing transformation of order flow into a comprehensible form, easy and clear for visual perception.
Confluence Identifier
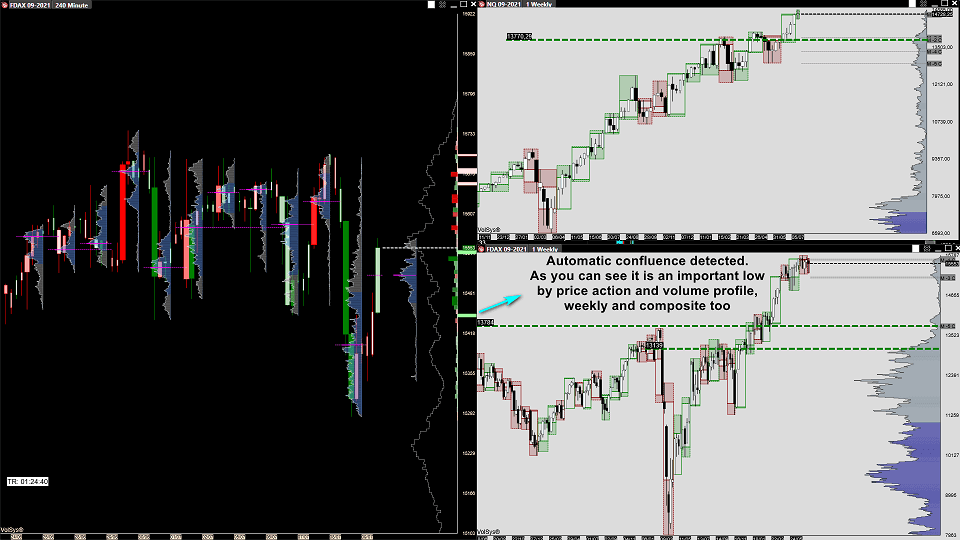
One of the thing to do when you analyze the markets is searching confluence of information in order to improve the possibilty of a winning trade and it is what confluence identifier indicator is built for
This indicator combines daily, weekly, monthly, composite Profile, zig-zag Swing and fibonacci retracements providing macro and micro levels of Supply and Demand based both on price and volumes.
Correlation Viewer
It is also usefull to compare the markets each other in order to idenitfy which is stronger or weaker; we have developed a tool, which is called Correlation viewer, that has the scope to correlate the various market resulting an immediatly view of the stregths. The user can select various time frames in order to have a complete picture from short term to the long term.
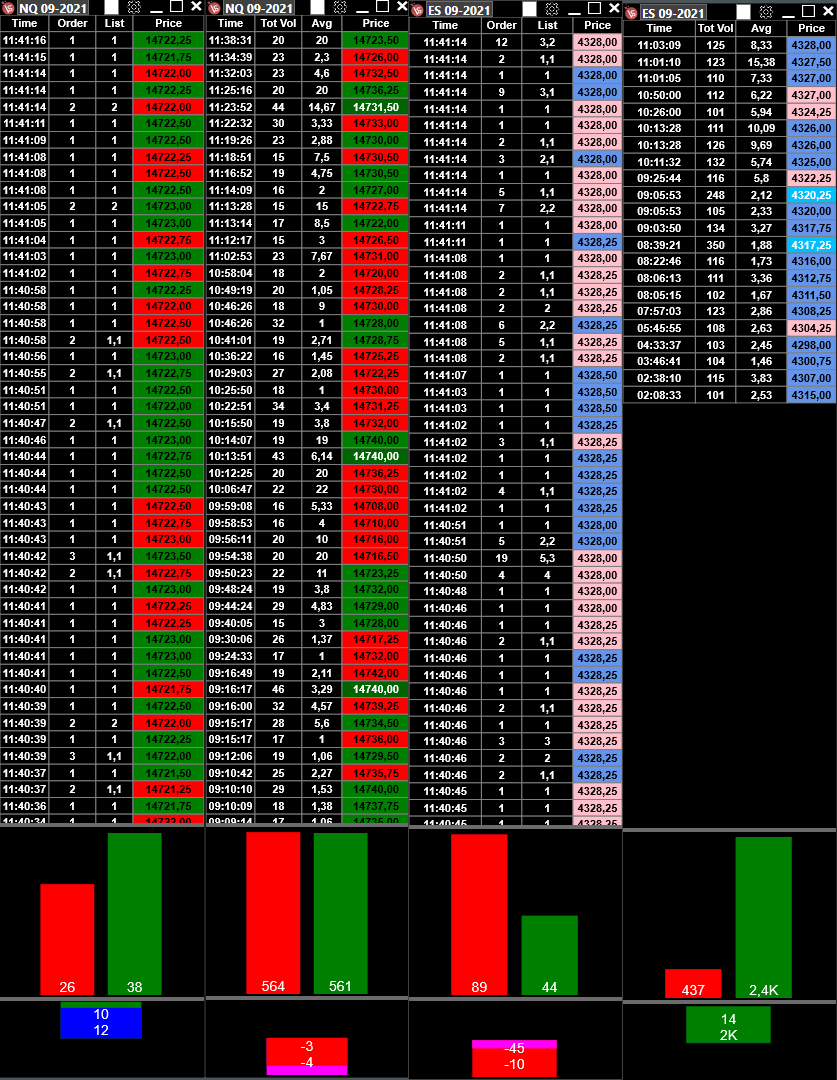
Advanced Time and Sales

Starting from late 2009, you have almost never seen the real size of the executed orders in the ordinary time and sales which is available on the most known platforms like NinjaTrader or MultiCharts; thanks to the improve of the technology and the speed of the netowrk, almost every large market order/trade is broken into small pieces, so it has become very complicated to identify them.
For example, a 200 lots market order can be displayed in your ordinary tape in many individual prints and it would impossible to rebuild the original order.
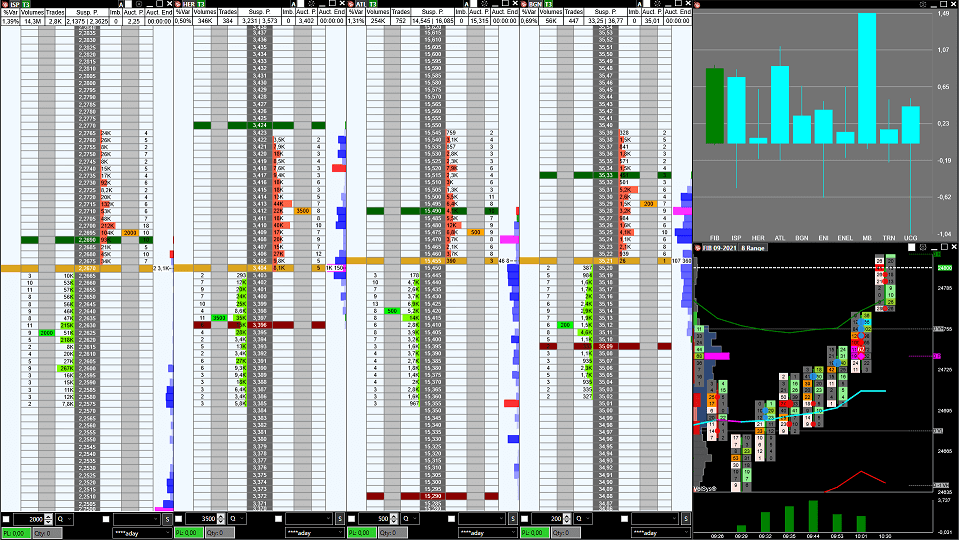
Our version of tape (Advanced T & S), combines individual prints back together (the way it used to be before 2009) so that you can easily see the actual market orders to their full extent and it allows you to filter the size of ther orders so you easily sense what the bigger/smaller traders are doing at the moment.
It is also possible to enable relative sound alarms with the possibilty to show some other essential information including Iceberg Orders and Quantity Order entered associated at the trades executed.
Trading
VolSys® allows traders to connect in the same instance multiple data sources and multiple brokers simultaneously and this allows you to trade separating the feed from the broker in order to choose always the most competitive one.
In addition to trading from the advanced dom, it is also possible to trade directly from the chart with OCO strategy, breaking the position in small pieces and close them at different prices, or fast order submission with shortcuts on the keyboard.
VolBook®
VolBook®is a professional volume trading platform which offers an innovative way for the display and the analysis of the market detph without neglecting the study of the level 1. We have made a huge effort in order to build the heatmap with property display algorithm.
Book Liquidity Chart

The heart of the platform is the market depth analysis through a heatmap where each price level changes color based on the amount of limit order placed at that level, helping traders to identify support and resistence book zone and where the markets is going to because the price goes up and down searching the liquidity in order to execute orders.
It would be impossible to analyze it on the common vertical book and you would lose what happened on the post and how the liquidty has changed at that level.
VolBook® supports the full depth where it is available, so it is possible over than 1000 levels and it is really important for this kind of analysis; we also offer the historical depth of the day. Volume profile is one of the most powefull volume indicators becuase it highlights the most interested zone of price and how they were executed thanks to the delta profile.
Volume bubbles

VolBook® combines the analysis of the level 2(market depth) with the level 1(time and sales) thanks to the volume bubbles indicator. The trades are displayed as bubbles which size depends on the amount of volume executed and which is the aggression(buyer or sellers)
This function allows you to identify the book action like spoofing, layering or when the limit orders are really executed; the indicator is fully customisable in terms of colors, filters, grouping mode and so on
Volume Profile
Volume profile is one of the most powefull volume indicators becuase it highlights the most interested zone of price and how they were executed thanks to the delta profile.
The abilty to read the profile is one of the most important key for a successfully market analysis with the volume and it is also not so easy, because when we see a profile, you should be also to identify the shape of the distribution, unbalanced zones, pseudo point of control(POC) and many other things.
Chart Dom
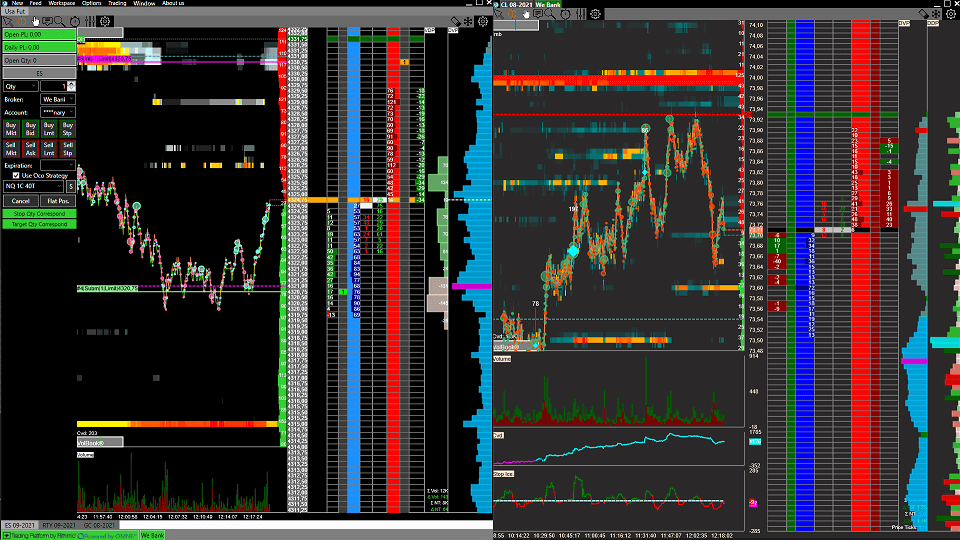
To help scalper traders we have thought a tool, called Chart Dom. which allows traders to insert orders in a very fast way; it is not just an order submission, but it also analyzes pull and stack order and executed one.
Chart Dom allows traders to place limit order (left mouse click) and market order (right mouse click) with only one click.
VolBook also supports Oco Order Strategy, in which way you can break your position in small pieces, putting multiple stop and target orders.
Iceberg and stops
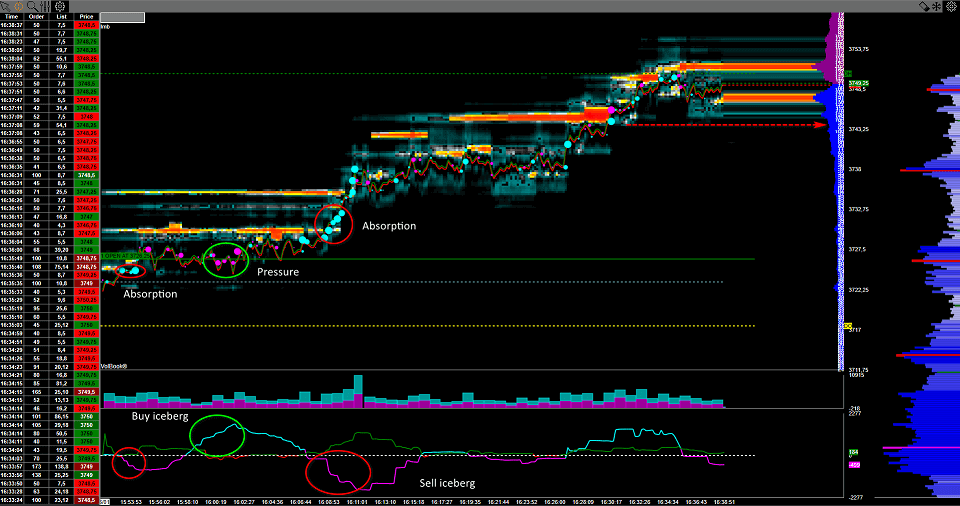
Thanks to the market by order (MBO), VolBook® can recognize executed iceberg and stop orders in the market, highlighting interesting moments.
Iceberg orders are native iceberg and they are available on CME Group with Rithmic data feed, while in the italian stock market we have developed an algorithm in order to detect them with VolRT
Stop orders are not native because the market doesn’t send that kind of informations, but they are detected thanks an algorithm.
Advanced Time and Sales
Starting from late 2009, you have almost never seen the real size of the executed orders in the ordinary time and sales which is available on the most known platforms like NinjaTrader or MultiCharts; thanks to the improve of the technology and the speed of the netowrk, almost every large market order/trade is broken into small pieces, so it has become very complicated to identify them.
For example, a 200 lots market order can be displayed in your ordinary tape in many individual prints and it would impossible to rebuild the original order.
Our version of tape (Advanced T & S), combines individual prints back together (the way it used to be before 2009) so that you can easily see the actual market orders to their full extent and it allows you to filter the size of ther orders so you easily sense what the bigger/smaller traders are doing at the moment.
It is also possible to enable relative sound alarms with the possibilty to show some other essential information including Iceberg Orders and Quantity Order entered associated at the trades executed.
 Open an account
Free Demo Account
Free Demo Account
Open an account
Free Demo Account
Free Demo Account
Our Approach
You and your broker will work together to achieve your trading goals. We develop long term
relationships with our clients so that we can grow and improve together.
Learn More About Choosing Cannon
Our Platforms
Please click on one of our platforms below to learn more about them, start a free demo, or open
an account.
E-Futures
Sierra Charts
Firetip (Mac Compatible)
RTrader
Trading Education
Recommended Resources
Guide to Risk and Opportunities of Futures and Options Trading
Steps to Successful Day-Trading
Day Trading Webinar


