What is ISystems Automated Trading System?
Gain access to over 1000 Automated Trading Systems - created by 13 professional developers, tracked in real-time.
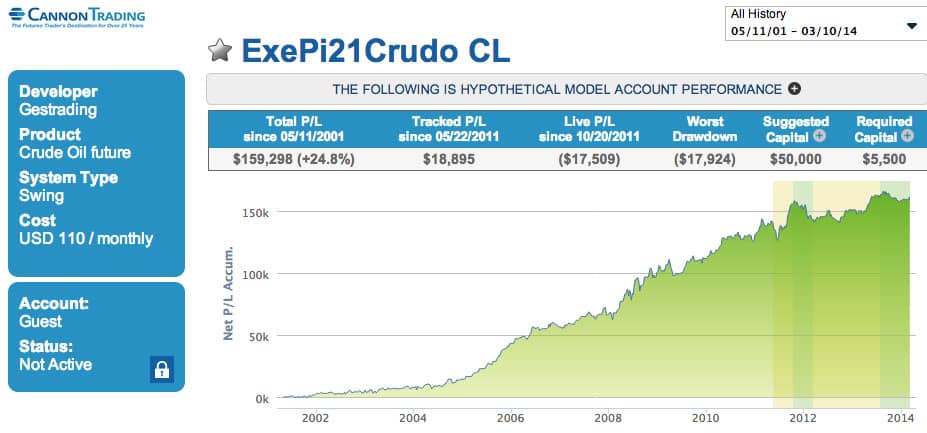
Cannon Trading Company is excited to be one of the first firms to offer connectivity to the iSystems Automated Trading System Platform. The platform allows clients to browse 100s of automated trading systems - with the ability to view overall performance, monthly profit/loss, trade logs, and all the relevant risk/reward statistics. Clients can then subscribe to systems they like, and activate the systems for live trading in their account - choosing how many contracts to trade; whether to get in line with the algorithm or wait until the next signal, and then monitor all of the activity in real time on the website with the ability to start and stop systems at any time they choose.
Trading systems can remove the emotions and provide consistency to your trading, while most have the profile of risking a small amount on each trade while looking to make several times that amount.
How Does It Work?
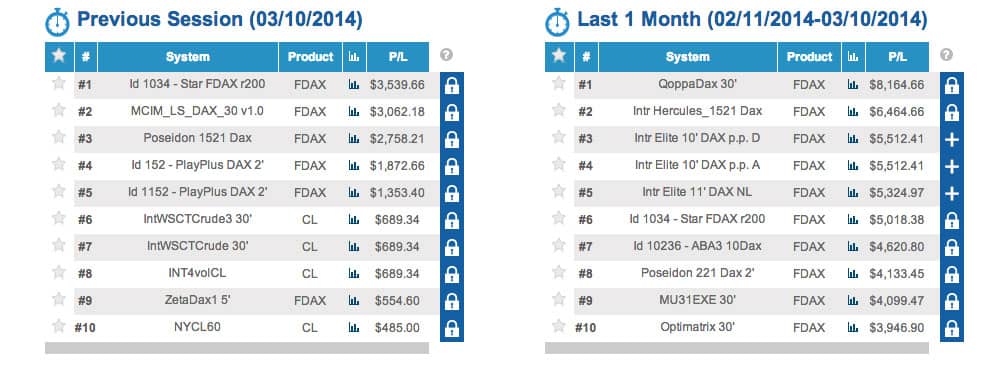
1. Browse Systems by Name, Market, Annual Return, and Required Investment
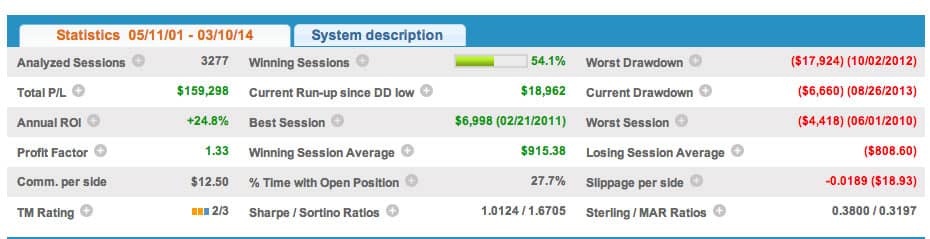
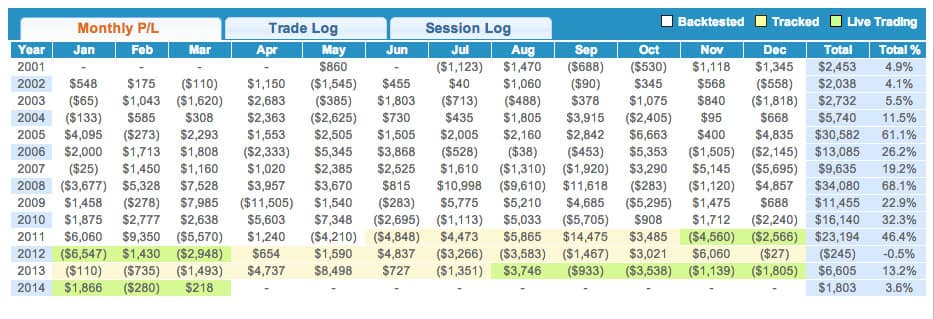
2. View Specific System's Equity Curve, Risk & Reward Ratios, Monthly Profit/Loss, Trade Logs, Worst Loss and more…
3. Lease the Rights to Different Systems with Easy-ClickSubscribePaid From Your Trading Account
4. Activate Licensed Systems for LIVE Trading in Your Account, Selecting How Many Contracts Per Signal…
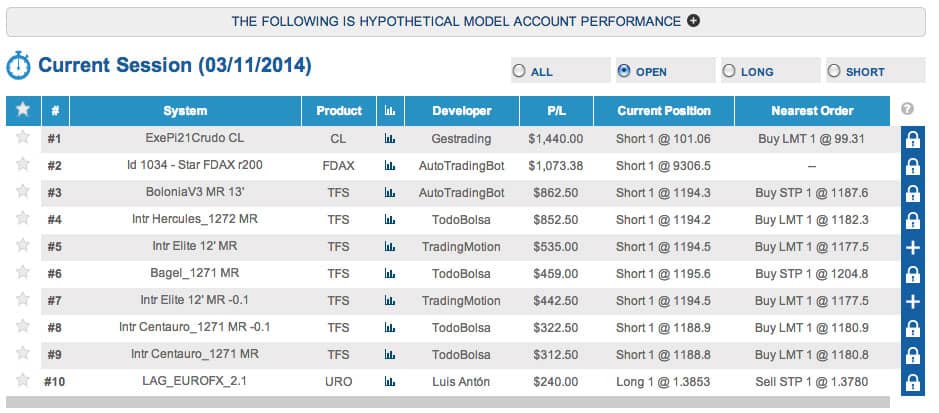
5. Follow Along… Tracking Open Positions, Filled Orders, and Performance by System, Market, and All-Time P/L
Want to Learn More?
Download ISystems Overview and ISystems Cheat Sheet PDFs to learn more.
Don't forget to test drive the ISystems by visiting Cannon Trading ISystems today. Feel free to give us feedbacks or if you have any questions that we can answer.
IMPORTANT RISK DISCLOSURE:Futures and forex trading is complex and carries the risk of substantial losses. It is not suitable for all investors. The ability to withstand losses and to adhere to a particular trading program in spite of trading losses are material points which can adversely affect investor returns.
The returns for trading systems listed on the iSystems Platform are hypothetical in that they represent returns in a model account. The model account rises or falls by the average single contract profit and loss achieved by clients trading actual money pursuant to the listed system's trading signals on the appropriate dates (client fills), or if no actual client profit or loss available –by the hypothetical single contract profit and loss of trades generated by the system's trading signals on that day in real time (real-time) less slippage, or if no real time profit or loss available –by the hypothetical single contract profit and loss of trades generated by running the system logic backwards on back adjusted data (back adjusted).
The hypothetical model account begins with the initial capital level listed, and is reset to that amount each month. The percentage returns reflect inclusion of commissions, fees, slippage, and the cost of the system. The monthly cost of the system is subtracted from the net profit/loss prior to calculating the percentage return.
If and when a trading system has an open trade, the returns are marked to market on a daily basis, using the back adjusted data available on the day the computer back test was performed for back tested trades, and the closing price of the then front month contract for real time and client fill trades. For a trade which spans months, therefore, the gain or loss for the month ending with an open trade is the marked to market gain or loss (the month end price minus the entry price, and vice versa for short trades).
The actual percentage gains/losses experienced by investors will vary
depending on many factors, including, but not limited to: starting account balances,
market behavior, the duration and extent of investor's participation (whether or not all
signals are taken) in the specified system and money management techniques. Because of
this, actual percentage gains/losses experienced by investors may be materially
different than the percentage gains/losses as presented on this website.
Please read carefully the CFTC required disclaimer regarding hypothetical results below.
HYPOTHETICAL PERFORMANCE RESULTS HAVE MANY INHERENT LIMITATIONS, SOME OF WHICH ARE
DESCRIBED BELOW. NO REPRESENTATION IS BEING MADE THAT ANY ACCOUNT WILL OR IS LIKELY TO
ACHIEVE PROFITS OR LOSSES SIMILAR TO THOSE SHOWN; IN FACT, THERE ARE FREQUENTLY SHARP
DIFFERENCES BETWEEN HYPOTHETICAL PERFORMANCE RESULTS AND THE ACTUAL RESULTS SUBSEQUENTLY
ACHIEVED BY ANY PARTICULAR TRADING PROGRAM. ONE OF THE LIMITATIONS OF HYPOTHETICAL
PERFORMANCE RESULTS IS THAT THEY ARE GENERALLY PREPARED WITH THE BENEFIT OF HINDSIGHT.
IN ADDITION, HYPOTHETICAL TRADING DOES NOT INVOLVE FINANCIAL RISK, AND NO HYPOTHETICAL
TRADING RECORD CAN COMPLETELY ACCOUNT FOR THE IMPACT OF FINANCIAL RISK OF ACTUAL
TRADING. FOR EXAMPLE, THE ABILITY TO WITHSTAND LOSSES OR TO ADHERE TO A PARTICULAR
TRADING PROGRAM IN SPITE OF TRADING LOSSES ARE MATERIAL POINTS WHICH CAN ALSO ADVERSELY
AFFECT ACTUAL TRADING RESULTS. THERE ARE NUMEROUS OTHER FACTORS RELATED TO THE MARKETS
IN GENERAL ORTOTHE IMPLEMENTATION OF ANY SPECIFIC TRADING PROGRAM WHICH CANNOT BE FULLY
ACCOUNTED FOR IN THE PREPARATION OF HYPOTHETICAL PERFORMANCE RESULTS AND ALL WHICH CAN
ADVERSELY AFFECT TRADING RESULTS
The information contained in the reports within this site is provided with the objective of "standardizing" trading systems account performance and is intended for informational purposes only. It should not be viewed as a solicitation for the referenced system or vendor. While the information and statistics within this website are believed to be complete and accurate, we cannot guarantee their completeness or accuracy. As past performance does not guarantee.


Managed accounts and algo trading have become integral components of the futures trading landscape. These approaches allow traders and investors to leverage the expertise of professional account managers and harness the power of algorithmic trading strategies. This article delves into the world of managed accounts and algo trading in the context of futures trading, discussing who manages these accounts, the past performance of account managers, risks associated with third-party management, the history of managed futures accounts, and the substantial sums of capital under management.
1. Who Manages Managed Futures Accounts?
Managed futures accounts are typically managed by professional traders, money managers, or commodity trading advisors (CTAs). These individuals or firms specialize in trading futures contracts on behalf of their clients. Managed futures programs can be offered by various entities, including hedge funds, proprietary trading firms, and registered CTAs.
- a. CTAs (Commodity Trading Advisors): CTAs are registered with regulatory bodies and provide trading advisory services to clients. They design and execute trading strategies in futures markets on behalf of investors. CTAs may employ discretionary, systematic, or algorithmic trading approaches.
- b. Hedge Funds: Hedge funds often have managed futures strategies as part of their overall investment portfolio. They deploy skilled traders and automated trading systems to manage futures positions.
- c. Proprietary Trading Firms: Proprietary trading firms engage in trading for their own account and may also manage managed futures accounts. They leverage their trading expertise and infrastructure to execute strategies on behalf of clients.
2. Past Performance of Account Managers
Evaluating the past performance of account managers is crucial for investors considering managed futures accounts. Performance data can provide valuable insights into the manager's skill, risk management, and ability to generate returns. However, it's important to remember that past performance is not indicative of future results, and there are several factors to consider when assessing a manager's track record:
- a. Historical Performance: Investors should review a manager's historical performance, including returns, risk-adjusted metrics, and drawdown statistics. Analyzing multiple years of performance data can help assess consistency.
- b. Risk Management: A manager's ability to control risk and limit drawdowns is critical. Review risk metrics, such as the Sharpe ratio, Sortino ratio, and the maximum drawdown experienced.
- c. Market Conditions: Examine how the manager's performance fared under various market conditions, including bull markets, bear markets, and periods of high volatility.
- d. Transparency: Transparent reporting of performance results, trading strategies, and risk management practices is essential. This transparency instills trust and confidence in the manager.
- e. Verification: In some cases, account managers may provide audited performance data, which can be independently verified for accuracy.
Example of Past Performance:
Suppose an investor is considering a managed futures account managed by a CTA. The CTA has a historical track record of achieving an average annual return of 12% over the past five years, with a maximum drawdown of 8%. This data suggests a history of consistent performance and an effective risk management approach. However, the investor should conduct due diligence and evaluate other aspects of the manager's strategy.
3. Risks of Third-Party Management
While managed futures accounts offer benefits, they are not without risks. Entrusting a third party to manage your capital carries inherent challenges that investors must be aware of:
- a. Manager Skill: The success of a managed account is highly dependent on the skills and expertise of the account manager. Poor decision-making or a lack of risk management can lead to losses.
- b. Fees: Managed accounts often involve management fees and, in some cases, performance fees. These costs can erode a significant portion of returns if the account does not perform well.
- c. Lack of Control: Investors have limited control over the trading decisions made in their managed accounts. They must rely on the manager's judgment and strategy execution.
- d. Market Risk: Futures trading is inherently risky, and there is a possibility of losing capital, regardless of the manager's skill.
- e. Counterparty Risk: Investors should consider the counterparty risk associated with the entity managing the account. It's essential to choose reputable and regulated managers.
- f. Lack of Liquidity: Some managed accounts may have lock-up periods or redemption restrictions, limiting an investor's ability to access their capital when needed.
Example of Risks:
Suppose an investor chooses a managed futures account with a performance fee structure. If the account manager fails to generate positive returns, the investor may still be required to pay the management fee, resulting in a net loss. Additionally, if the investor needs to liquidate the account during a market downturn, they may face redemption restrictions, limiting their ability to access their funds promptly.
4. Managed Futures Account History
Managed futures accounts have a rich history that dates back several decades. The concept of commodity trading advisors (CTAs) and managed futures programs began to gain prominence in the 1970s. This approach was initially aimed at providing investors exposure to commodities and commodity-related derivatives. Over the years, managed futures evolved and expanded to include various futures contracts, asset classes, and trading strategies.
Key milestones in the history of managed futures accounts include:
- a. Emergence of CTAs: The 1970s saw the rise of CTAs, who offered systematic trading strategies in commodity futures markets. This period marked the birth of managed futures programs.
- b. Growth in Managed Futures Assets: Throughout the 1980s and 1990s, the assets under management in managed futures accounts grew significantly as investors sought portfolio diversification and alternative sources of returns.
- c. Regulatory Framework: Regulatory bodies, including the U.S. Commodity Futures Trading Commission (CFTC), introduced regulations to oversee CTAs and protect investor interests.
- d. Expansion of Strategies: Managed futures strategies expanded to include not only commodity futures but also financial futures, foreign exchange (Forex), and other derivatives. Diversification strategies became common.
- e. Increased Institutional Interest: Managed futures attracted institutional investors, including pension funds and endowments, seeking uncorrelated returns and risk management.
- f. Integration of Algo Trading: The integration of algorithmic trading (algo trading) and artificial intelligence (AI) further transformed managed futures. Advanced algorithms and AI-driven models became instrumental in executing trading strategies.
5. Total Assets Under Management
The total assets under management (AUM) in managed accounts, including managed futures accounts, have experienced significant growth over the years. While exact figures can fluctuate, the managed futures industry has seen substantial capital inflows from a diverse range of investors.
As of my knowledge cutoff date in January 2022, the AUM in managed futures accounts were estimated to be in the hundreds of billions of dollars. However, the precise figure may vary due to market fluctuations and changes in investor sentiment.
The growth in AUM can be attributed to various factors, including the desire for portfolio diversification, the pursuit of uncorrelated returns, and the adoption of alternative investment strategies. Additionally, the integration of algo trading and AI-driven approaches has contributed to the industry's evolution and attracted more assets.
Managed accounts and algo trading play a vital role in the world of futures trading, offering investors the opportunity to access professional management and advanced trading strategies. Account managers, including CTAs, hedge funds, and proprietary trading firms, oversee managed futures accounts, bringing their expertise to the table.
When considering managed futures accounts, evaluating the past performance of account managers is essential, but it's crucial to recognize that past results are not guarantees of future performance. Investors must also be aware of the risks associated with third-party management, including fees, lack of control, and market risk.
The history of managed futures accounts highlights their evolution from a focus on commodity trading to a broader range of asset classes and strategies. The industry has experienced substantial growth in assets under management, with investors seeking diversified portfolios and uncorrelated returns.
In the world of futures trading, managed accounts and algo trading offer avenues for both experienced and novice investors to explore innovative strategies and harness the potential of automated trading systems. Nevertheless, it is paramount for investors to conduct thorough due diligence and consider their risk tolerance when entering the managed futures space.
Ready to start trading futures? Call US 1(800)454-9572 - Int’l (310)859-9572 email info@cannontrading.com and speak to one of our experienced, Series-3 licensed futures brokers and start your futures trading journey with Cannon Trading Company today.
Disclaimer - Trading Futures, Options on Futures, and retail off-exchange foreign currency transactions involves substantial risk of loss and is not suitable for all investors. Past performance is not indicative of future results. You should carefully consider whether trading is suitable for you in light of your circumstances, knowledge, and financial resources. You may lose all or more of your initial investment. Opinions, market data, and recommendations are subject to change at any time.
**This article has been generated with the help of AI Technology. It has been modified from the original draft for accuracy and compliance reasons.
 Open an account
Free Demo Account
Free Demo Account
Open an account
Free Demo Account
Free Demo Account
Our Approach
You and your broker will work together to achieve your trading goals. We develop long term
relationships with our clients so that we can grow and improve together.
Learn More About Choosing Cannon
Our Platforms
Please click on one of our platforms below to learn more about them, start a free demo, or open
an account.
E-Futures
Sierra Charts
Firetip (Mac Compatible)
RTrader
Trading Education
Recommended Resources
Guide to Risk and Opportunities of Futures and Options Trading
Steps to Successful Day-Trading
Day Trading Webinar


