SPY-to-RSP ratio
CANNON FUTURES ACADEMY
Lesson · Market Internals Series
The Generals and the Soldiers
How to Read the SPY-to-RSP Ratio — and Tell a Rotation from a Breakdown
Eli G Levy · Cannon Trading Company · eli@cannontrading.com
A Cannon Futures Academy teaching note. Worked example uses the tech sell-off of October 7 – November 2, 2026.
What you’ll learn in this lesson
By the end you’ll be able to do four things. First, explain what the SPY-to-RSP ratio measures and why it moves. Second, sort any market into one of four regimes using the ratio plus the direction of the equal-weight index. Third, read the October–November 2026 tech sell-off through that lens. Fourth, run a five-minute check every time big tech drags the index lower.
Why a futures trader should care
The E-mini S&P 500 (ES) is a cap-weighted contract, so your P&L tracks the generals. When a few trillion-dollar companies move, ES moves with them — whatever the other 490 stocks are doing.
That is exactly why ES on its own can mislead you. In a narrow market the index can make new highs while most stocks go nowhere, and that rally is fragile. In a rotation the index can sag while most stocks quietly rise, and that dip is often bought. The headline number looks the same in both cases. The trade is not.
The SPY-to-RSP ratio separates the two in one line on a chart. It answers a simple question: is the index being carried by a few giants, or by the whole army?
The one-line version
A falling SPY-to-RSP ratio during a tech sell-off is a rotation when the equal-weight index is holding up or rising, and a breakdown when the equal-weight index is falling too. Always read the ratio together with the direction of RSP.
VOCABULARY FIRST
The six terms you need
Keep these in your back pocket. Everything after this is just these terms in motion.
| Term | What it means in plain language |
| Cap-weighted index | Each stock counts in proportion to its market value, so the biggest companies dominate. The S&P 500 and the ES contract work this way. |
| Equal-weighted index | The same 500 stocks, but each gets the same slice (about 0.2%), reset every quarter. The smallest member counts as much as the largest. |
| SPY | The SPDR S&P 500 ETF. It tracks the cap-weighted S&P 500 — the generals. |
| RSP | The Invesco S&P 500 Equal Weight ETF. It tracks the equal-weighted S&P 500 — the soldiers. |
| SPY-to-RSP ratio | SPY’s price divided by RSP’s price. Rising means the big names are beating the average stock; falling means the average stock is beating the big names. |
| Concentration | How much of the index’s weight and return comes from its largest few members. High concentration makes the index hostage to a handful of earnings reports. |
Table 0 — Glossary. Refer back to this whenever a term below feels unfamiliar.
CONCEPT 1
What the ratio actually measures
SPY and RSP hold the same 500 companies. The only difference is how much each company counts. So when you divide one by the other, everything the two funds share cancels out — and what is left is pure concentration: are the biggest names doing better or worse than the typical member?
That is why the ratio is such a clean gauge. It strips out the market’s direction and shows you only who is doing the lifting.
Teaching point
The ratio tells you who is leading. It does not tell you whether the market is healthy. For that you need a second reading: is RSP itself rising or falling?
CONCEPT 2 — THE BIG ONE
The four regimes
Pair the ratio’s direction with RSP’s direction and every market falls into one of four boxes. This table is the core of the lesson.
| Ratio (SPY ÷ RSP) | RSP (equal weight) | Regime | How it tends to trade |
| Rising | Rising | Narrow advance. Everything is up, but the giants do most of the work. | Healthy, but a growing share of the index rests on a few earnings reports. |
| Rising | Falling | Hollow index. The giants hold the index up while the average stock rolls over. | The classic late-rally warning: the headline hides weakness underneath. |
| Falling | Rising | Rotation. Money leaves the leaders and spreads across the rest of the index. | Index dips tend to be shallow; breadth improves even on red days. |
| Falling | Falling | Leadership breakdown. The generals fall and the soldiers can’t catch them. | The dangerous one: the largest weights drag the index and nothing offsets them. |
Table 1 — The four regimes. The ratio’s direction alone cannot separate a rotation from a breakdown; RSP’s direction does.
Notice the trap in the bottom two rows. In both, the ratio is falling and the headlines read “tech sell-off.” Yet one is a market changing its leadership, and the other is a market losing it. A trader who watches only ES, or only the ratio, cannot tell them apart.
Teaching point
A falling ratio is a question, not an answer. Before you react, check RSP. Rising or flat means rotation; falling means the selling is broad.
CONCEPT 3 — THE LONG VIEW
From the 2022 breakdown to a record
The ratio closed at a record 3.69 on October 7, 2026, after a three-year climb — then fell 7.4% in less than four weeks. To see why that move matters, look at where the climb came from.
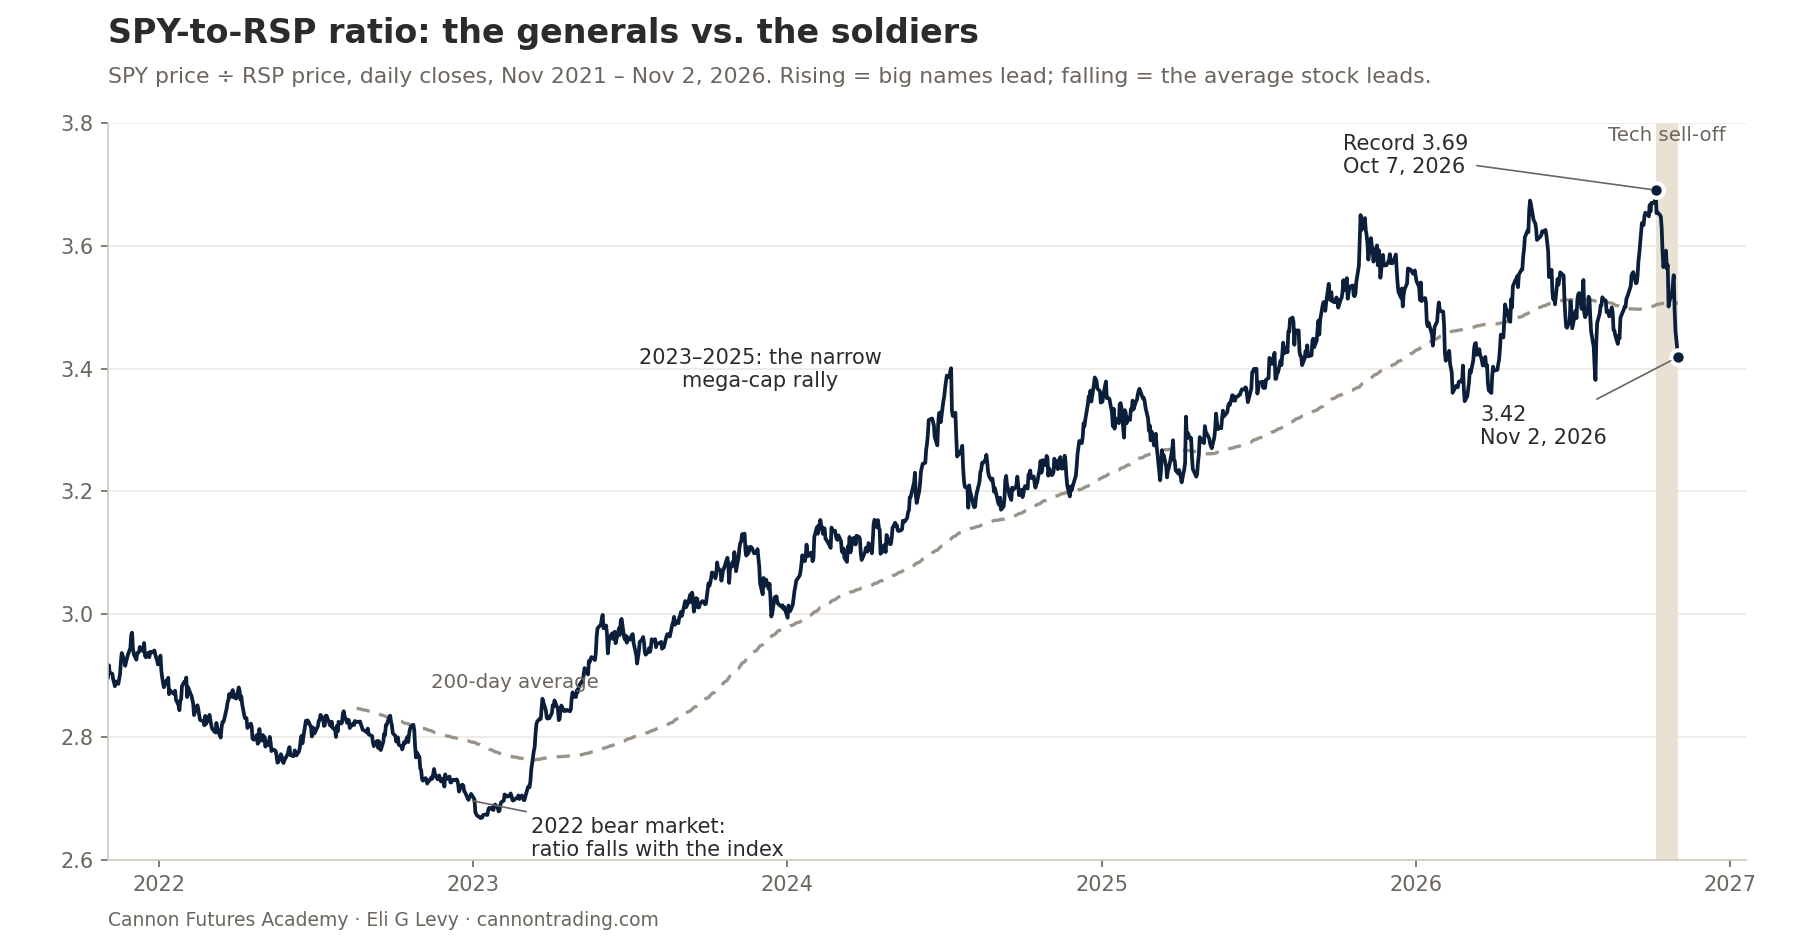
Figure 1 — SPY-to-RSP ratio, daily closing prices, with its 200-day average. The shaded band is the October 7 – November 2, 2026 tech sell-off.
2022 is the dangerous box. From SPY’s close on January 3, 2022 to its low close on October 12, 2022, SPY fell 25.4% and RSP fell 21.4%. The ratio fell because the giants led the way down — but the average stock fell hard too. That is a leadership breakdown, the bottom row of Table 1.
2023 to 2025 is the narrow advance. The giants did most of the lifting for three straight years.
| Calendar year | SPY price change | RSP price change | Ratio change |
| 2023 | +24.3% | +11.7% | +11.3% |
| 2024 | +23.3% | +11.0% | +11.0% |
| 2025 | +16.4% | +9.3% | +6.4% |
Table 2 — Price change only, dividends excluded. Over three years the cap-weighted fund roughly doubled the equal-weight fund’s gain.
That run is why concentration became the market’s biggest single risk. When a handful of companies carry the index, their earnings and spending plans move ES more than any economic release. The October 2026 sell-off is what it looks like when that risk is finally tested.
Teaching point
A ratio at a record high is not a sell signal. It means the index is leaning on fewer shoulders. The question is what happens when those shoulders stumble.
CONCEPT 4 — THE WORKED EXAMPLE
The tech sell-off, October 7 to November 2
From the October 7 close to the November 2 close, SPY fell 3.2% while RSP rose 4.5%, and the ratio dropped from 3.69 to 3.42. The selling hit AI hardware and the largest platforms hardest, after heavier capital-spending plans and weak chip-maker results renewed doubts about the payoff from AI spending.
| Fund | What it holds | Oct 7 close | Nov 2 close | Change |
| SMH | Semiconductor stocks | 625.03 | 508.31 | −18.7% |
| QQQ | Nasdaq-100 | 757.73 | 681.09 | −10.1% |
| MAGS | The seven largest U.S. tech names | 73.69 | 68.19 | −7.5% |
| SPY | S&P 500, cap-weighted | 777.22 | 752.10 | −3.2% |
| RSP | S&P 500, equal-weighted | 210.60 | 219.98 | +4.5% |
Table 3 — Daily closing prices, price change only. The further a fund leans on big tech, the worse it did.
Read the table from top to bottom and the story tells itself. The more a fund depends on the AI trade, the more it lost. The equal-weight fund — where a chip maker counts no more than a utility or a regional bank — gained ground.
The two sessions that show it best
Friday, October 30 was the sharpest day of the sell-off. SPY fell 1.77% and QQQ fell 3.47%, while SMH lost 6.98%. RSP fell only 0.79% — less than half of SPY’s drop.
Monday, November 2 was the clearest rotation day. SPY slipped 0.48% and SMH fell another 2.71%, yet RSP rose 0.76%. Advancing S&P 500 stocks outnumbered decliners by 189, and 55% of the index’s volume went into rising stocks. The index was red, but more of its members went up than down.
What breadth was doing underneath
The share of S&P 500 members above their own 200-day moving average climbed from 48.7% at the October 12 close to 64.0% at the November 2 close. Even on October 30, the worst day of the move, 30 members made new 52-week highs against 4 new lows. Those are not the readings of a market in liquidation. They are the readings of a market changing hands.
Teaching point
In a rotation the index and its members disagree: ES goes down while breadth goes up. That disagreement is the signal, and the SPY-to-RSP ratio is the fastest way to see it on one chart.
CONCEPT 5 — THE CONFIRMATION
The verdict, and the four readings to watch
Through the November 2 close, this sell-off sits in the rotation box: the ratio is falling while RSP is rising. That is a very different market from 2022, when both fell together. Money has left the AI leaders, but it has stayed in stocks and spread across the rest of the index.
There is a catch for futures traders. ES is cap-weighted, so a rotation can still pull the contract lower day after day — the rising members are small weights and the falling ones are huge. A healthy tape underneath does not stop ES from grinding down when the generals are the ones being sold.
A rotation can also turn into a breakdown. These are the four readings that would tell you it has:
- RSP’s own direction. The deciding reading. RSP closed November 2 at 219.98, 1.3% below its record close of 222.77 on August 14. If RSP starts falling alongside SPY, the market moves into the leadership-breakdown box — the 2022 template.
- The ratio against its 200-day average. The ratio closed below its 200-day average, near 3.51, on October 29 and has stayed under it since. A snap back above that line while RSP falls would mean the hollow-index pattern is returning.
- The ratio against its February low. The 2026 low close was 3.35 on February 27. A break below it would mean the rotation is deepening — good for breadth, but it keeps pressure on the cap-weighted contracts.
- Breadth holding up. Readings near 60% of S&P 500 members above their 200-day average say the rotation is intact. A slide back toward the 40s on red index days would say the selling has spread from the generals to the soldiers.
How to read the result
RSP rising while the ratio falls → rotation. Dips in ES tend to be absorbed by the rest of the market, though the contract can still drift lower.
RSP falling with the ratio → breakdown. Nothing is offsetting the giants, and that is when sell-offs extend.
The futures-only version of the same check
You can run the generals-versus-soldiers test with futures alone. Compare the Nasdaq-100 contract (NQ) with ES to see whether tech is leading or lagging, and the Russell 2000 contract (RTY) with ES to see whether smaller companies are joining in. When NQ lags ES and RTY holds up, money is rotating. When all three fall together, the giants are dragging everything with them.
SET IT UP
The ratio in TradingView, in two minutes
- Plot the ratio. Open a chart and type SPY/RSP in the symbol search; TradingView draws it as a single line.
- Pick the frame. Daily bars, one to two years, so you see the trend and the recent swing.
- Add the average. From Indicators, add a Moving Average and set its length to 200 — the dashed line in Figure 1.
- Open RSP beside it. Switch to a two-chart layout and put RSP in the second pane. The ratio tells you who is leading; RSP’s own chart tells you whether the soldiers are advancing or retreating.
- Add the futures view. Put ES1!, NQ1! and RTY1! in one watchlist and compare their daily percentage changes.
MAKE IT REPEATABLE
The five-minute checklist
Every time a “tech sell-off” headline crosses your feed, run these five steps in order.
- Check the ratio’s direction. Is SPY-to-RSP falling? Then the giants are underperforming.
- Check RSP’s direction. Rising or flat means rotation; falling means the selling is broad.
- Place it in the four-box table. Name the regime before you name a trade.
- Confirm with breadth. Share of members above their 200-day average, new highs vs. new lows, up vs. down volume.
- Translate it to futures. NQ against ES, RTY against ES — and remember ES can drift lower even in a healthy rotation.
Key takeaways
- The SPY-to-RSP ratio measures concentration. It strips out market direction and shows only who is leading.
- A falling ratio can mean rotation or breakdown. RSP’s own direction decides which.
- The ratio set a record at 3.69 on October 7, 2026, capping three years of mega-cap leadership.
- Through November 2 the tech sell-off has been a rotation: SPY down 3.2%, RSP up 4.5%, breadth improving.
- The warning sign is RSP turning lower with SPY. That is the 2022 pattern, and it is when sell-offs extend.
Methodology & caveats
The ratio is SPY’s daily closing price divided by RSP’s daily closing price. It is a price ratio, not a total-return ratio: dividends are excluded, and because RSP pays a somewhat higher yield, the price ratio drifts slightly in SPY’s favor over long periods. All fund prices and percentage changes are price-only daily closes, cross-checked across two independent market-data feeds. “Record” means the highest closing value since RSP began trading in 2003. The ratio’s 200-day average is a simple average of its last 200 daily closes.
This is educational market analysis for the Cannon Futures Academy. Nothing here is a recommendation to buy or sell any security or futures contract. Trading futures involves substantial risk of loss and is not suitable for every investor.
Sources
- State Street SPDR — SPDR S&P 500 ETF Trust, SPY (ssga.com)
- Invesco — S&P 500 Equal Weight ETF, RSP (invesco.com)
- S&P Dow Jones Indices — S&P 500 Equal Weight Index methodology (spglobal.com/spdji)
- Nasdaq — historical daily quotes for SPY, RSP, QQQ, SMH and MAGS (nasdaq.com)
- Yahoo Finance — SPY and RSP daily price history, cross-check (finance.yahoo.com)
LEGAL DISCLOSURE & RISK WARNING
Cannon Trading Company
This publication is provided by Cannon Trading Company for informational and educational purposes only. Content may include market commentary, technical observations, analyst opinions, and aggregated material derived from publicly available sources. While such information is believed to be reliable, Cannon Trading Company does not author, independently verify, endorse, or guarantee the accuracy, completeness, or timeliness of any third‑party information referenced or summarized herein.
The information, opinions, market data, and commentary contained in this publication are subject to change at any time without notice and do not constitute investment advice, a solicitation, or a recommendation to buy or sell any security, futures contract, option on futures, foreign currency transaction, or any other financial instrument.
Past performance is not indicative of future results.
Trading Futures, Options on Futures, retail off‑exchange foreign currency transactions, and other derivatives involves substantial risk of loss and is not suitable for all investors. You may lose all or more than your initial investment. Carefully consider whether trading is appropriate for you in light of your experience, objectives, financial resources, and other relevant circumstances.
Cannon Trading Company does not guarantee any profits and makes no representation that the strategies, ideas, analyses, or information presented will result in profitable trades or avoid losses. Any market views, analyst calls, forecasts, or third‑party commentary referenced reflect the opinions of their respective authors and may or may not align with the views of Cannon Trading Company.
Cannon Trading Company is registered solely as a commodities broker. Nothing contained herein constitutes the provision of investment advisory services.
© 2026 Cannon Trading Company, Inc. All rights reserved.
cannontrading.com • 1‑800‑454‑9572 • (310) 859‑9572