The Complacency Crack: A Semiconductor Scare Breaks the Calm
By Eli Levy, Senior Analyst & Series 3 Broker
Bottom Line
For most of the year, this market has climbed a remarkably quiet staircase. This week, it discovered the elevator shaft.
Semiconductors
The unwind started where the crowd was most comfortable: semiconductors. It kicked off Monday with SK Hynix’s largest single-day drop on record after a downbeat read on memory pricing and HBM4 shipments, and the pain didn’t stay contained. Micron (MU) finished the week down roughly 10% and SanDisk about 24%; the broader complex followed, with the SOX index — and ETFs that track it like SMH and SOXX — logging their worst week since March 2025. Even beat-and-raise quarters from Taiwan Semiconductor (TSM) and ASML couldn’t hold their stocks up.
Stocks/AI
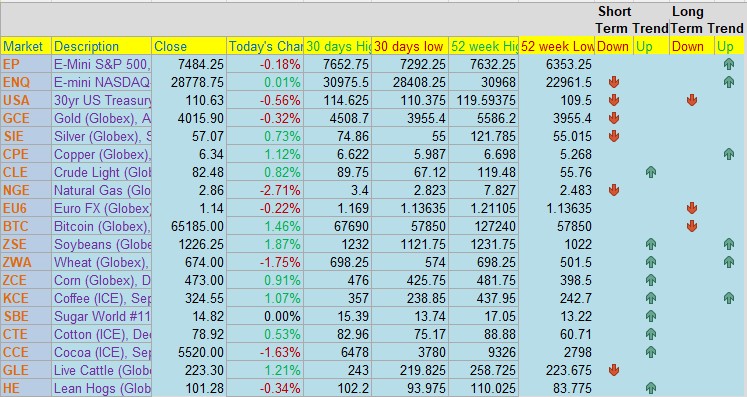
By Friday the selling had spread out of chips and into the megacaps, with Netflix (NFLX) tumbling roughly 8–11% on soft guidance and Nvidia (NVDA) and Alphabet (GOOGL) both lower. The S&P 500 (SPX) closed the week around 7,457, off about 1.6%, slipping below its 50-day moving average while still holding the 200-day line it has defended since April. The Nasdaq fell about 2.5%. Faced with a fast-moving set of questions about the AI growth story, investors adopted a simple posture: sell now, ask questions later.
And the questions are real. Corporate budgets are visibly shifting toward AI infrastructure — the abruptness of that shift showed up violently in IBM’s roughly 25% one-day collapse, its worst in decades, as clients redirected spending away from software toward chips and memory.
Chinese labs are releasing cheaper, competitive models; new memory supply is heading toward IPO; and enterprises are quietly moving from spending on tokens at any cost toward squeezing more out of the tokens they already buy.
Crude Oil
Layer on oil — WTI crude up double digits on the week to its highest since mid-June as the U.S.–Iran standoff tightened around the Strait of Hormuz — and you have the combination that unsettles a richly valued market: uncertain returns on the biggest spending theme, plus a fresh inflation tail.
Stock Indices
But that’s only one side of the story, and the other side is genuinely strong. Underneath the volatility, this was an excellent earnings week. The big banks posted historic numbers — JPMorgan (JPM) profit up 41%, Goldman Sachs (GS) up 78% on record equities trading and an all-time-high stock, Bank of America (BAC) up 27%, Citigroup (C) up 45%, Wells Fargo (WFC) up 17%. Of the roughly four dozen S&P 500 names that have reported, the vast majority beat on both the top and bottom lines.
The rally has been broadening rather than narrowing: the equal-weight S&P is outpacing the cap-weight version for the year, S&P breadth sits at its highest since late 2024, and the money that left chips rotated straight into energy, insurers, health care and value — Travelers (TRV) jumped nearly 8% on earnings, and transports like J.B. Hunt (JBHT) led. That is what a healthy, widening market looks like: leadership changing hands rather than simply collapsing. Even bonds offered reassurance — despite the oil spike, the 10-year Treasury yield drifted lower on a flight-to-safety bid, closing near 4.54%.
Final Thoughs
So, the tape leaves us with a divided picture rather than a verdict. On one shoulder sits a de-risking, not a breakdown — a semiconductor-specific scare inside a broadening advance, with the 200-day line intact and earnings humming. On the other sits a list of risks stacking up at once: AI return-on-investment doubts, an oil-driven inflation and rates threat, and a market that had grown comfortable at the highs.
Next week is light on economic data but heavy on earnings — with Alphabet (GOOGL) reporting Wednesday against already-elevated capex guidance of $180–190B — which should tell us which shoulder the market decides to lean on.
For now, we do what we always do: watch the levels, respect the rotation, and let the tape lead.
|