Fixed Income V. Fixed Yield
4% for Sure, or Stay in the Game?
Bottom Line
By Eli Gal Levy, Senior Analyst
Is the risk worth the reward at this point?
The question I keep getting is not about a level. It’s about whether to be in this market at all. Stay invested while indexes print records or take a guaranteed yield in short-term paper and sit this out until it works itself out. It sounds like the conservative choice, and it is — but conservative is not the same as costless. Every decision in this tape charges you something, including the decision to do nothing.
Government Backed Fixed Income Instruments
Start with what the safe side actually pays. Short-term government-backed fixed income instruments are yielding between 3.70% and 4.24%, depending on the exact asset class and duration. Move out the curve and the five-year note pays 4.41%, the benchmark ten-year 4.71%. Those numbers are contractual. They don’t depend on anyone’s earnings model, anyone’s target, or anyone’s read of a chart. The catch is that they are also the ceiling.
Fixed Yield
If you settle for a fixed yield and the market keeps running past that rate, the difference isn’t a paper loss on a statement — it’s a gain you agreed in advance not to have. And a 4.24% bill sounds like a win until you set it against 3.4% inflation: that’s about eight tenths of a point of actual gain in buying power, and that’s before the IRS takes its cut of it as ordinary income. In a 30% bracket you’re netting under 3%, which is less than the rate prices are climbing.
Certainty is a perfectly defensible thing to buy. Just be clear that you’re buying it, not getting it for free.
2026 Wall Street Targets
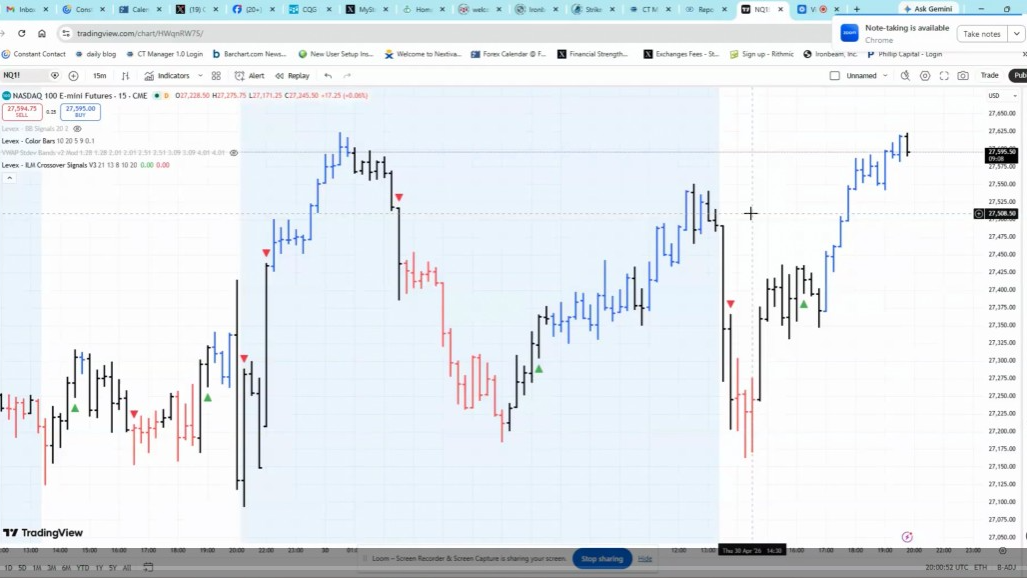
Now the other column. Wall Street’s year-end 2026 targets for the S&P 500 range from 7,500 to 8,400, and the reasoning behind the range has been consistent across the major institutions: continued corporate earnings growth, and artificial intelligence infrastructure investment that keeps confirming itself in orders, capex guidance and backlogs rather than in slide decks. Measured from an index that first traded above 7,800 this month, the top of that range sits roughly eight percent away. That’s the reward the risk-free yield is being weighed against — and it’s the number that makes locking in 4% feel expensive.
?
Then there’s the other half of the same research. The same desks publishing those targets also mark where a pullback would go looking for a bid: a primary technical support zone between 6,800 and 7,100, which is a standard 10% to 15% correction off the recent record highs. So, the shape of the choice, stated plainly, is something like eight percent of upside to the optimistic target against ten to fifteen percent of downside to the first serious support shelf — versus a guaranteed low-four handle that surrenders both.
Anyone telling you that’s an obvious call in either direction is selling you something.
Bonds
What keeps it close rather than settled is the bond market, and that’s where I’ve been spending my time. Yields appear to be resuming their selloff, and the selloff in government bonds has been leaning on the momentum trade — plausibly because so many AI-linked names sit inside the momentum basket. As those companies have turned to debt financing for a larger share of their capex, higher borrowing costs land directly on the same valuations the bull case depends on.
AI
That’s the uncomfortable symmetry of this cycle: the AI buildout is simultaneously the earnings story holding the market up and the supply story pressing on the long end. One trade, two bills. High yields and rising rates are bad for earnings growth for the simple reason that they raise corporate interest expense — and so far, the market hasn’t minded, because we’ve made new all-time highs in the S&P, the Dow and the Russell anyway. How long that indifference lasts is the actual open question, and it’s not one I’m going to pretend to answer.
VIX
The tape’s own testimony this week was calm to the point of being conspicuous. Volatility stayed subdued, with the VIX falling to an eight-month low. Read one way, that’s confirmation: no stress in the system, credit behaving, participation broadening — the Russell at a record is the small-cap risk-on signal I follow for exactly this reason, and gold and software both cleared their 200-day. Read the other way, an eight-month low in volatility is a thin cushion, and thin cushions are the condition in which a modest catalyst produces an immodest move. Both readings are honest. Both are live right now.
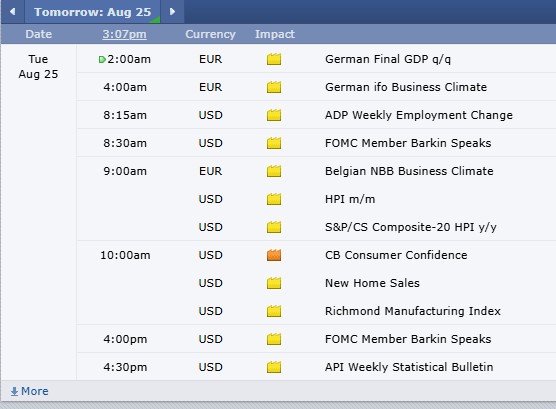
And there’s plenty on the calendar to adjudicate it — PCE midweek, and the biggest name in the AI complex reporting Wednesday after the close. That’s not a prediction. It’s just where the information is.
Invest or Park?
The framing itself deserves one caveat. The question gets posed as all-or-nothing — fully invested or fully parked — and in practice it almost never is. Duration, position size and what you’re willing to hold through a 12% drawdown are separate decisions from whether you own equity risk at all, and they’re the ones that usually determine the outcome.
So: two columns, both with real numbers in them. On one side, a contractual 3.70% to 4.24% with no drawdown and no opportunity. On the other, a target range that implies high-single-digit upside, a support zone that implies double-digit downside, and a bond market that gets a vote in which one arrives first. I’m not going to hand you a verdict on that, because I don’t have one.
Need help looking at different markets? get some insight from an experienced series 3 broker?
+310 859 9572
|