This blog provides daily support and resistance levels for major commodities, indices, and financial futures contracts, along with market outlooks and insights.
FOMC: The Fed Hiked, the Dow Flinched, and the Market Took It All Back in a Day | Important – September 23rd, 2026
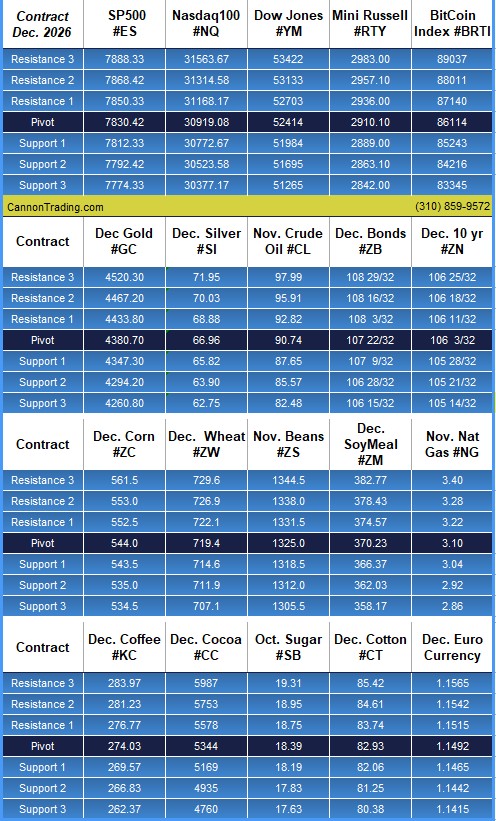
At A Glance Levels
Instrument
S2
S1
Pivot
R1
R2
Gold (GC)
— Dec. (#GC)
4342.00
4379.40
4409.60
4447.00
4477.20
Silver (SI)
— Dec. (#SI)
64.69
65.80
66.85
67.95
69.00
Crude Oil (CL)
— Oct. (#CL)
93.00
94.34
96.18
97.52
99.36
Dec. Bonds (ZB)
— Dec. (#ZB)
106 5/32
106 18/32
107 8/32
107 21/32
108 11/32
FOMC: The Fed Hiked, the Dow Flinched, and the Market Took It All Back in a Day
By Eli Gal Levy, Senior Analyst
Is the risk worth the reward at this point? Part 4
The question I keep getting is not about a level. It’s about whether to be in this market at all. Stay invested while indexes print records or take a guaranteed yield in short-term paper and sit this out until it works itself out. It sounds like the conservative choice, and it is — but conservative is not the same as costless. Every decision in this tape charges you something, including the decision to do nothing.
The Fed hiked, the Dow flinched, and the market took it all back in a day.
Going into the week, the Fed was 86.5% priced to hike. By Wednesday afternoon it had, and the S&P still finished the week within a rounding error of where it started: 7,656.98 on the prior Friday against 7,637.76 at Thursday’s close. The index was almost flat, but a lot happened underneath it. Chips sold off hard then came back, the 10-year broke 5% and came back, the Dow lost 631 points in one session, and a hot regional survey saved the bull case the next morning.
Monday–Tuesday: AI safety hits the chips, and yields cross 5%
The week opened on an argument about AI rather than earnings. Anthropic’s Dario Amodei published an essay calling on labs to “pace the rate of capabilities advancement.” OpenAI’s Sam Altman and Microsoft’s Satya Nadella agreed with him. The chip index fell 5.86% on Monday, Teradyne lost 13.3% and Coherent 12.7%, and Micron, Broadcom and CoreWeave went down with them.
The money moved to incumbents and security names: CrowdStrike rose 13.9%, Palo Alto 13.1% and Microsoft closed green. D.A. Davidson’s Gil Luria called the pacing talk “Machiavellian.” Broadcom’s Hock Tan said AI revenue targets “haven’t changed.” Dan Ives of Yorkville Ives called it “yelling fire into a crowded theater.” Read that way, Monday was a rotation inside AI, not a verdict against it.
Rates did the rest. The 10-year crossed 5% for the first time since October 2023. Tuesday’s 20-year auction tailed two basis points at 5.420%, with the weakest foreign demand on record. Bank of America’s Brian Moynihan guided third-quarter investment-banking fees to $1.6–1.8 billion against roughly $2 billion expected.
BofA fell 5.1% and Goldman 4.0%, and both finished the week down about 7%, their worst weeks since April 2025. The S&P fell to 7,585.73 by Tuesday’s close, and David Keller’s 7,600 “line in the sand” gave way.
Wednesday: the hike, and the dots that mattered more
The FOMC raised rates 25 basis points to 3.75–4.00%. The vote was unanimous, 12–0, and it was the first hike since 2023. The dot plot did more damage than the decision. The 2026 median moved to 4.1% from 3.8%, 16 of 18 participants see at least one more hike this year, and the 2027 median sits at the same 4.1%. The 2% inflation goal is not projected until 2029. The Fed didn’t just push easing back a meeting; it took easing off the horizon entirely.
The tape split in two. The Dow lost 631 points (−1.21%) while the Nasdaq closed flat. The hike hit rate-sensitive names: J.B. Hunt fell 13.3% and took freight with it, and Lennar missed on both lines with orders down 9%. The AI supply chain ignored it. Lumentum gained 9.6%, and Generac jumped about 18% the next day on a reported deal of up to $8 billion to supply backup generators for Amazon data centers. Two-year yields rose while the 30-year didn’t move, a textbook bear flattener.
Thursday: the premise test passes
The bulls needed one thing: an economy strong enough to take the hike. Thursday gave it to them. The Philadelphia Fed survey printed 37.8 against 30.5 expected, and jobless claims came in at 196,000 against 208,000. The S&P rallied 1.14%, the Nasdaq 1.69% and the Dow won back half its loss. The 10-year slipped back under 5% and the VIX fell 12.8% to 15.44. Housing told the other half of the story, with starts, permits and pending home sales all missing. That’s the rate channel working where it always shows up first. Abroad, the Bank of England held at 3.75% with three votes for a hike, and the Bank of Japan raised to 1.25%, its highest since 1995.
The technical picture
Dealers were short gamma all week, so their hedging amplified moves instead of damping them. The gap between cash and the gamma flip went from 8 points on Monday morning to 151 after the Fed, then shrank back to 20.5 by Friday morning. The option corridor moved around too. The put wall slid from 7,600 to 7,500 and returned to 7,600, and the call wall dropped from 7,700 to 7,600 before rising to 7,650. Friday’s quarterly expiration, about $6.2 trillion of notional according to Citadel Securities, landed alongside the index rebalance and reset the whole map.
Breadth is where the damage is. BTIG’s Jonathan Krinsky pointed out that the share of S&P names above their 200-day average closed at 49%. That was the first time since April 2000 it had fallen below 50% with the index within 4% of a record. The 200-day reading recovered Thursday, but only about 31% of stocks are above their 50-day. AAII bears jumped to 53.3%, which two technicians read as a contrarian buy signal.
Who moved?
Ed Yardeni cut his year-end target from 8,400 to 7,900, the Street’s highest bull stepping down. It’s a cut to the valuation multiple, not to earnings. He flagged a Japanese carry-trade unwind as potentially “more consequential than the Fed’s rate hike.”
Tom Lee (Fundstrat) raised his target to 8,200. He had called for a Fed hold and got it wrong, then turned to buying the dip. By Thursday his “hike pulls the ten-year down” thesis had played out, a day late.
Savita Subramanian (BofA) raised her Street-low target from 7,100 to 7,400, but still says a pullback is “overdue.”
Jeffrey Gundlach (DoubleLine) said he would have dissented in favor of 50 basis points. Mohamed El-Erian (Allianz) would have preferred no hike at all, and Rick Rieder (BlackRock) graded equities “a B minus.”
Chris Verrone (Baird Strategas) made the best call of the week: “they probably go twice,” before the dots said the same. Scott Chronert (Citi) also got it right with 5% on the 10-year as the tactical line, a test that played out both ways inside two days.
Scott Rubner (Citadel Securities) told clients to fade Thursday’s bounce. He expects equities to trade lower over the next two weeks on supply and demand into month-end.
Goldman’s David Mericle and JPMorgan’s Michael Feroli both flipped to a hike before the meeting. Morgan Stanley’s Andrew Sheets now expects December and March moves, to 4.25–4.50%.
Mark Mahaney (Evercore ISI) raised his Alphabet target to $450.
What to carry into next week
First, oil. WTI spent the week between $101 and $106, with the Saudi East-West pipeline shut. RBC’s Helima Croft puts roughly 9 million barrels a day of Middle Eastern supply offline, and diesel keeps outrunning crude. Second, the long end. Goldman’s Ben Snider notes that stocks stop absorbing yield moves once the 10-year rises more than 50 basis points in a month. Third, the Fed path is still unsettled.
The 2-year sits 81 basis points above the funds rate, a curve priced for a full cycle, while prediction markets price about one more hike. Those two can’t both be right, and one of them will have to reprice.
I am biased toward the tape. I follow what the market does, not what I think it should do. Right now the tape is a percent off its highs with volatility at a year-to-date low, the front end pricing a hike, and breadth thinning underneath — and I will keep watching the ten-year, the credit spreads, the equal-weight index and the HYG ETF to tell me when that changes.
Need help looking at different markets? get some insight from an experienced series 3 broker?
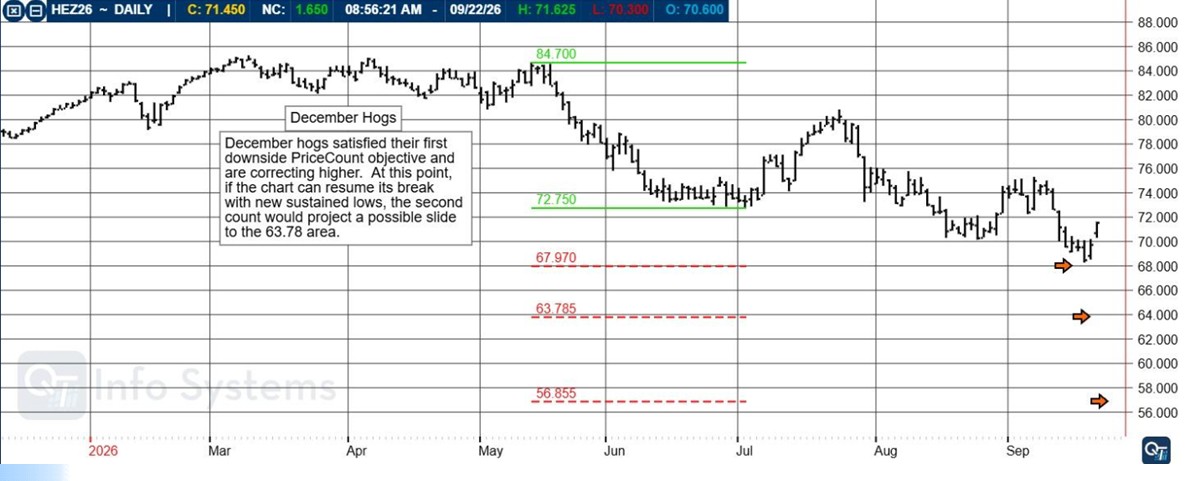
December Hogs satisfied their first downside PriceCount objective and are correcting higher. At this point, if the chart can resume its break with new sustained lows, the second count would project a possible slid to the 63.78 area.
The PriceCount study is a tool that can help to project the distance of a move in price. The counts are not intended to be an ‘exact’ science but rather offer a target area for the four objectives which are based off the first leg of a move with each subsequent count having a smaller percentage of being achieved.
It is normal for the chart to react by correcting or consolidating at an objective and then either resuming its move or reversing trend. Best utilized in conjunction with other technical tools, PriceCounts offer one more way to analyze charts and help to manage your positions and risk.
Trading in futures, options, securities, derivatives or OTC products entails significant risks which must be understood prior to trading and may not be appropriate for all investors. Past performance of actual trades or strategies is not necessarily indicative of future results.
Cannon Edge — Your Daily Futures Snapshot for Sept. 23rd
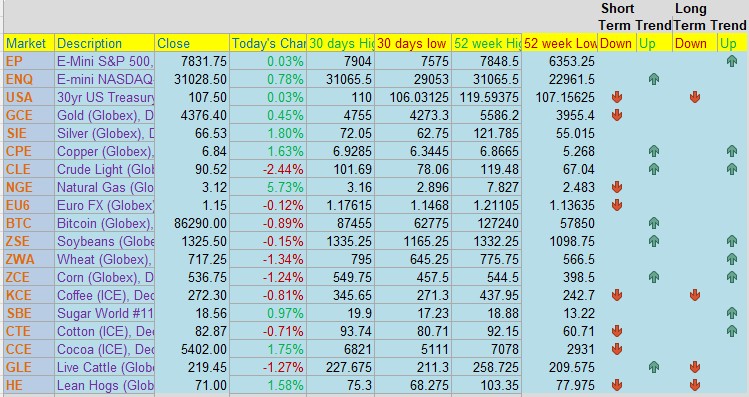
Cannon Edge is our new daily feature designed to give traders a fast, actionable overview of key futures markets. Each post delivers:
· Current price and daily % change
· 30‑day and 52‑week highs/lows
· PROPRIETARY Short‑term and long‑term trend signals
· Coverage across equity indices, metals, energies, currencies, and ags
Whether you’re scanning for breakout setups, trend reversals, or just staying informed — Cannon Edge puts the data in your hands before the open.
Built for speed. Backed by insight. Powered by CQG.
Trading Futures, Options on Futures, and retail off-exchange foreign currency transactions involves substantial risk of loss and is not suitable for all investors. You should carefully consider whether trading is suitable for you in light of your circumstances, knowledge, and financial resources. You may lose all or more of your initial investment. Opinions, market data, and recommendations are subject to change at any time.
RISK DISCLOSURE: Past results are not necessarily indicative of future results. The risk of loss in futures trading can be substantial, carefully consider the inherent risks of such an investment in light of your financial condition.