Daily Support & Resistance Levels

This blog provides daily support and resistance levels for major commodities, indices, and financial futures contracts, along with market outlooks and insights.

November 6, 2026
Grain Futures

Your Important VIX and Post-Election Futures Trading Outlook | November 9th, 2026

7cfe5b36 db9f 4933 824a 7f264613e7fe

Cannon Futures Weekly Letter

In Today’s Issue #1315

  • The Week Ahead – Post Elections, PPI, CPI, China & More

  • FREE Trading Class

  • Gold Automated Trading System

  • Soymeal Chart & Outlook

  • Cannon Edge – Your Futures Trading Map for the week ahead!

  • Trading Levels for Next Week
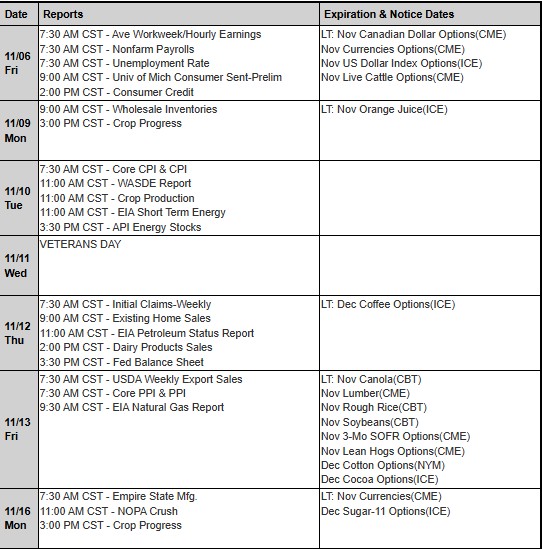
  • Trading Reports for Next Week

At A Glance Levels

Instrument S2 S1 Pivot R1 R2

Gold (GC)

— Dec. (#GC)

3778.73 3837.07 3937.63 3995.97 4096.53

Silver (SI)

— Dec. (#SI)58.79

46.78 48.08 50.20 51.50 53.62

Crude Oil (CL)

— Dec. (#CL)

100.91 101.94 103.47 104.50 106.03

 Dec. Bonds (ZB)

— Dec. (#ZB)

106 26/32 107 8/32 107 27/32 108 9/32 108 28/32

What Futures Traders Should Watch This Week

By John Thorpe, Senior Broker

vix

  Veterans Day is Wednesday Nov. 11th

All markets will have normal hours, Some banks, govt offices and credit unions may be closed. The weekly Crude Stocks report moves to Thursday @ Noon CST and the Nat Gas report moves to 10:30 am Friday.

VIX

The CBOE Volatility Index, or VIX, measures expected 30-day volatility for the S&P 500. It rose to 28.36 on Nov. 5th, marking a sharp change in market risk sentiment after recent concerns over inflation, interest rates, energy prices, and crowded AI-related trades.

Post Election Results

The Post election results were not kindly met by the traders as a sharp sell-off occurred due to two factors, one publicly acknowledged, according to traders and other industry experts, is the political wind change resulting from the Mid-term elections. Expected growth in the data center buildout will be reduced significantly by adding more regulation to the approval processes. Water, Power, land use, taxation are some of the areas experts see increased regulation.

China/Taiwan

The other factor, not so publicly acknowledged, is on Nov. 4th while the U.S. is inward looking post-election, China had, according the South China Morning Post sent 49 sorties of PLA aircraft in a 24-hour period around the Island of Taiwan.

Additionally, the head of Taiwan’s National Security Council Joseph Wu, reported over 100 People’s Liberation Army naval vessels and Chinese Coastguard vessels were actively conducting drills around the nation Island. If you recall, Beijing sees Taiwan as part of China to be reunited by force if necessary.


·        According to the Global Taiwan Institute, Taiwan manufactures over 60% of the world’s semiconductor output and more than 90 % of the worlds most advanced microchips. If China were to take Taiwan by force, what would happen to the supply of chips and semiconductors? And the impact on the US Stock market could be devastating given roughly 40% of the S&P 500 weighted average is represented by tech.

·        Apple Inc. (AAPL): ~7.39%

·        Nvidia Corp (NVDA): ~6.80%

·        Microsoft Corp (MSFT): ~5.85%

·        Amazon.com Inc (AMZN): ~4.15%

·        Alphabet Inc. (GOOGL/GOOG): ~5.19% combined

·        Meta Platforms, Inc. (META): ~2.31%

·        Broadcom Inc. (AVGO): ~2.16%

·        Tesla, Inc. (TSLA):

Earnings moves to midcaps with the exception of Cisco and Applied Materials Thursday and plenty of economic data to stir the drink Including CPI, PPI and WASDE in the Agricultural sector. 16 Fed Speakers will either entertain or antagonize the markets. check the calendar below for names and times.

Back to the VIX I posted the past few weeks and is worth repeating.

(you can trade the VIX futures with CannonTrading)


18–20

First warning zone

A break above the recent 18 area, followed by 20, would suggest increasing demand for downside protection.

22–25

Correction-stress zone

A sustained move into this range, particularly with the S&P 500 making lower lows, would signal a more meaningful deterioration in risk appetite.

30+

High-stress regime

A move above 30 would indicate substantial volatility expectations. Watch for widening credit spreads, weaker market breadth and forced selling.

The energy’s, metals, securities, grains and interest rates are swirling in the uncertainty from a lack of resolution in the attempted unwinding of the Iranian nuclear program.

Don’t let your guard down just yet, the fog continues, tune into the Sunday evening markets to witness reactions to the weekend news streams, manufactured or true.

  Plan your trade and trade your plan!

Earnings Next Week:

·        Mon.  KKR, Constellation Energy Occidental Petroleum

·        Tue. TransDigm, CoreWeave

·        Wed. Corteva, TetraTech

·        Thu. Cisco, Applied Materials

·        Fri. Quiet

Fed Speakers: (all times CDT)

·        Mon. Goolsbee 10:00 am, Barkin 12:15 pm, Bowman 12:15 pm, Goolsbee 3:00 pm

·        Tues.  Logan 9:35 am, Bowman 1:30 pm, Schmid 1:30 pm, Bowman 6:30 pm

·        Wed.  Quiet

·        Thu.   Hammack 9:00 am, Barr 10:00 am, Goolsbee 11:30 am, Daly 1:10 pm. Williams 6:30 pm

·        Fri.   Bowman 10:50 am, Daly Noon, Jefferson 7:00pm

Econ Data:

·        Mon. CB Trends, Wholesale inventories, Cons Inf. Expectations, 3-6 mo. T-Bill auction, 2 yr note auction

·        Tue. NFIB Optimism index, ADP weekly, CPI, 6-week Bill auction, Redbook, API Crude stock change   WASDE 11:00am

·        Wed. MBA Mortgage applications,

·        Thu. Initial Jobless Claims, Existing Home Sales, EIA Crude Stocks, 4-, 8- and 17-week bill auction, Fed Balance sheet, 30yr Bond auction

·        Fri. PPI, EIA Nat Gas Stocks Baker Hughes Oil Rig Count.

Free Live Class: Open Your Trading Day with Eli Levy

Join Eli Gal Levy live on Zoom every Tuesday at 10:00 AM ET for a free session to understand the markets. Eli walks through the overnight action, the key levels he’s watching in the E-mini S&P, Nasdaq, crude oil, gold, Treasuries and more, and the economic reports that could move markets that day or week. He also shares the risk-management habits that matter most when volatility picks up.

Eli has been trading since 1998 and is an educator in trading financial markets. He writes The Cannon Edge Pre-Market Briefing and the Weekly Technical Playbook, and he teaches futures trading courses at GalTrades.com.

REGISTER FREE →

Every Tuesday | 10:00 AM ET | Free on Zoom

Your personal Zoom link arrives by email as soon as you register.

Third-Party Links: Links to independent third-party websites are provided for informational purposes only and do not constitute an endorsement, recommendation, solicitation, or guarantee by Cannon Trading. We do not control and are not responsible for third-party content, claims, products, services, security, privacy practices, or regulatory compliance. Users are responsible for conducting their own due diligence before acting on third-party information. Futures trading involves substantial risk of loss and is not suitable for all investors. You may lose all or more than your initial investment. Past performance is not necessarily indicative of future results.

Brokers Trading System of the Week

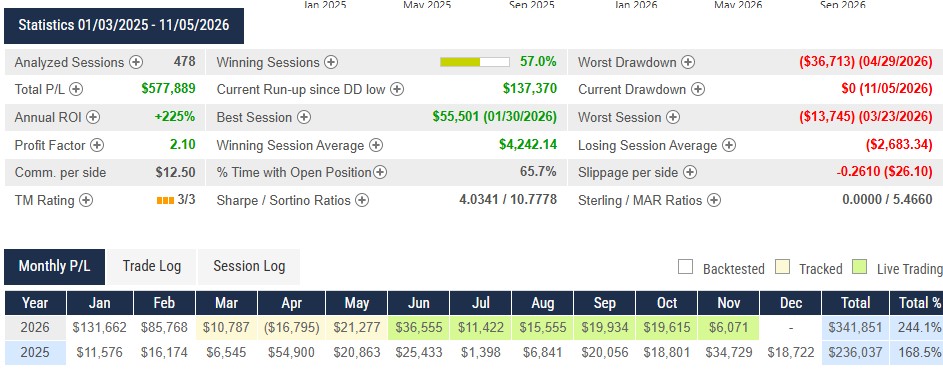
NEO LVL01DELTA intraday GOLD GC

Market Sector: Metals

Markets Traded:   GC – Gold Futures

System Type: Intraday

Risk per Trade: varies

Trading Rules: Partially Disclosed

Broker’s Suggested Capital: $70,000

Developer Fee per contract: $350.00 Monthly Subscription

Get Started

Learn More

e7489580 0c63 4b7b 89eb 394cafb1aee3
Disclaimer The risk of trading can be substantial and each investor and/or trader must consider whether this is a suitable investment. Past performance is not necessarily indicative of future results.

IMPORTANT RISK DISCLOSURE

Futures trading is complex and carries the risk of substantial losses. It is not suitable for all investors. The ability to withstand losses and to adhere to a particular trading program in spite of trading losses are material points which can adversely affect investor returns.

The returns for trading systems listed throughout this website are hypothetical in that they represent returns in a model account. The model account rises or falls by the average single contract profit and loss achieved by clients trading actual money pursuant to the listed system’s trading signals on the appropriate dates (client fills), or if no actual client profit or loss available – by the hypothetical single contract profit and loss of trades generated by the system’s trading signals on that day in real time (real-time) less slippage, or if no real time profit or loss available – by the hypothetical single contract profit and loss of trades generated by running the system logic backwards on backadjusted data (backadjusted).

Note that the Client Fill Trades are reported across all clients utilizing the platform, across multiple brokers, and are not based solely on the performance of accounts at this brokerage.

The hypothetical model account begins with the initial capital level listed, and is reset to that amount each month. The percentage returns reflect inclusion of commissions, fees, slippage, and the cost of the system. The monthly cost of the system is subtracted from the net profit/loss prior to calculating the percentage return.

If and when a trading system has an open trade, the returns are marked to market on a daily basis, using the backadjusted data available on the day the computer backtest was performed for backtested trades, and the closing price of the then front month contract for real time and client fill trades. For a trade which spans months, therefore, the gain or loss for the month ending with an open trade is the marked to market gain or loss (the month end price minus the entry price, and vice versa for short trades).

The actual percentage gains/losses experienced by investors will vary depending on many factors, including, but not limited to: starting account balances, market behavior, the duration and extent of investor’s participation (whether or not all signals are taken) in the specified system and money management techniques. Because of this, actual percentage gains/losses experienced by investors may be materially different than the percentage gains/losses as presented on this website.

Please read carefully the CFTC required disclaimer regarding hypothetical results below. HYPOTHETICAL PERFORMANCE RESULTS HAVE MANY INHERENT LIMITATIONS, SOME OF WHICH ARE DESCRIBED BELOW. NO REPRESENTATION IS BEING MADE THAT ANY ACCOUNT WILL OR IS LIKELY TO ACHIEVE PROFITS OR LOSSES SIMILAR TO THOSE SHOWN; IN FACT, THERE ARE FREQUENTLY SHARP DIFFERENCES BETWEEN HYPOTHETICAL PERFORMANCE RESULTS AND THE ACTUAL RESULTS SUBSEQUENTLY ACHIEVED BY ANY PARTICULAR TRADING PROGRAM.

ONE OF THE LIMITATIONS OF HYPOTHETICAL PERFORMANCE RESULTS IS THAT THEY ARE GENERALLY PREPARED WITH THE BENEFIT OF HINDSIGHT.

IN ADDITION, HYPOTHETICAL TRADING DOES NOT INVOLVE FINANCIAL RISK, AND NO HYPOTHETICAL TRADING RECORD CAN COMPLETELY ACCOUNT FOR THE IMPACT OF FINANCIAL RISK OF ACTUAL TRADING.

FOR EXAMPLE, THE ABILITY TO WITHSTAND LOSSES OR TO ADHERE TO A PARTICULAR TRADING PROGRAM IN SPITE OF TRADING LOSSES ARE MATERIAL POINTS WHICH CAN ALSO ADVERSELY AFFECT ACTUAL TRADING RESULTS. THERE ARE NUMEROUS OTHER FACTORS RELATED TO THE MARKETS IN GENERAL OR TO THE IMPLEMENTATION OF ANY SPECIFIC TRADING PROGRAM WHICH CANNOT BE FULLY ACCOUNTED FOR IN THE PREPARATION OF HYPOTHETICAL PERFORMANCE RESULTS AND ALL WHICH CAN ADVERSELY AFFECT ACTUAL TRADING RESULTS.

The information contained in the reports within this site is provided with the objective of “standardizing” trading systems account performance and is intended for informational purposes only. It should not be viewed as a solicitation for the referenced system or vendor. While the information and statistics within this website are believed to be complete and accurate, we cannot guarantee their completeness or accuracy. As past performance does not guarantee future results, these results may have no bearing on, and may not be indicative of, any individual returns realized through participation in this or any other investment.

The statistics on this page are calculated via the combination of three hypothetical data sets:

1. Backtested, 2. Tracked, and where available 3. Live.

Backtested performance is calculated by running a trading system backwards in time, and seeing what trades would have been done in the past when applied to backadjusted data. Tracked performance is calculated by running the trading system forwards on data each and every day, and logging the trades as they happen in real time day after day. Live performance is calculated by running the trading system on live tick data for actual clients and tracking the actual buy and sell prices those clients trading the system receive in their account.

We use Live results to calculate monthly returns for any month in which clients were trading for the entire month, Tracked fills for those months in which there are no client fills for the entire month, and computer generated fills for those months occurring before we loaded the system onto our trade servers. The results are hypothetical in that they represent returns in a model account.

The model account rises or falls by the single contract profit and loss achieved by the system in whichever data set is available. The hypothetical model account begins with the Suggested Capital listed, and is reset to that amount each month. The percentage returns reflect inclusion of commissions, fees, slippage, and the cost of the system. The commission, slippage, fees, and monthly system costs are subtracted from the net profit/loss prior to calculating the percentage return.

Please note that the method of resetting the model account to the initial value at the start of each month creates a track record which is representative of the simple returns for each time period, but that it does not, by definition, show how returns would compound over time. Should an investor following said program trade a single contract indefinitely without also resetting their account to the initial capital amount each month, their performance will differ from the performance detailed herein.

thumbnail?url=https%3A%2F%2Fi.ytimg.com%2Fvi%2FkQ6gL4dSi4U%2Fhqdefault
Get a daily market edge—support & resistance levels plus key market-moving insights.

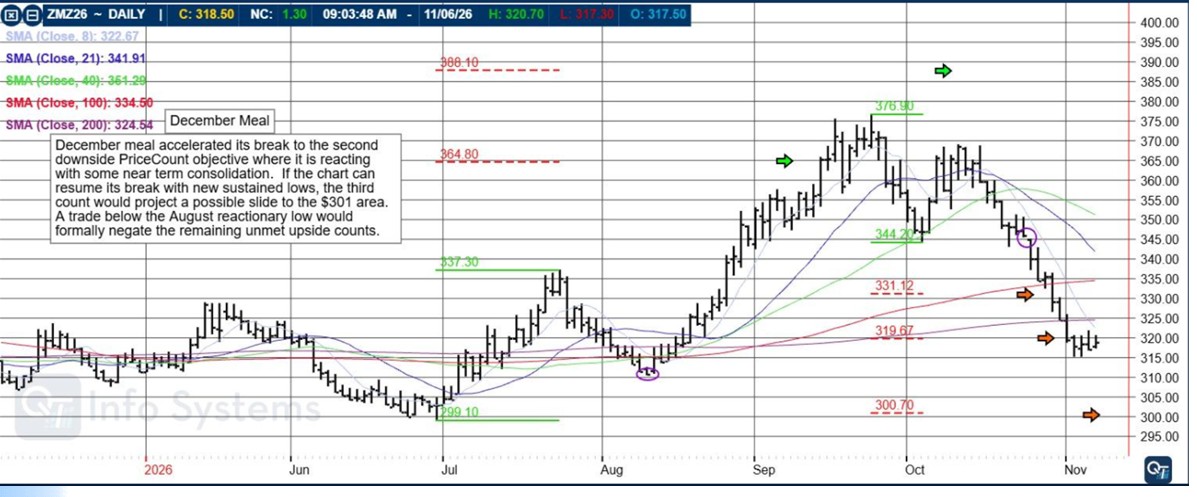
Dec. Soymeal

December Meal accelerated its break to the second downside PriceCount objective where it is reacting with some near term consolidation. If the chart can resume its break with new sustained lows, the third count would project a possible slide to the $301 area. A trade below the August reactionary low would formally negate the remaining unmet upside counts.

Schedule a one on one consultation with a licensed series 3 broker HERE

c0bb08b6 f132 4564 80e6 ec0226c2e897

The PriceCount study is a tool that can help to project the distance of a move in price. The counts are not intended to be an ‘exact’ science but rather offer a target area for the four objectives which are based off the first leg of a move with each subsequent count having a smaller percentage of being achieved.

It is normal for the chart to react by correcting or consolidating at an objective and then either resuming its move or reversing trend. Best utilized in conjunction with other technical tools, PriceCounts offer one more way to analyze charts and help to manage your positions and risk.

Learn more at https://www.qtinfo.com/analysis/qt-chart-of-the-day/

Trading in futures, options, securities, derivatives or OTC products entails significant risks which must be understood prior to trading and may not be appropriate for all investors. Past performance of actual trades or strategies is not necessarily indicative of future results.

FREE TRIAL TO QT MARKET Center – Access to analysis, tools, news & Much more!

Highly recommended for HEDGERS!

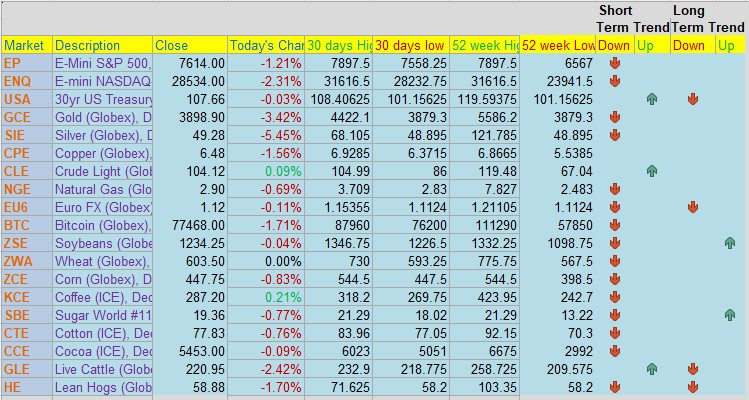
Cannon Edge — Your Daily Futures Insight for the Next Trading Day! Cannon Edge for Nov. 9th 2026

29aa304a ae66 40fc a16d d1da58ba46f9

Cannon Edge is our new daily feature designed to give traders a fast, actionable overview of key futures markets. Each post delivers:

  • Current price and daily % change
  • 30‑day and 52‑week highs/lows
  • PROPRIETARY Short‑term and long‑term trend signals
  • Coverage across equity indices, metals, energies, currencies, and ags

Whether you’re scanning for breakout setups, trend reversals, or just staying informed — Cannon Edge puts the data in your hands before the open.

Built for speed. Backed by insight. Powered by CQG.

Would you like to get weekly updates on real-time, results of Automated trading systems ?

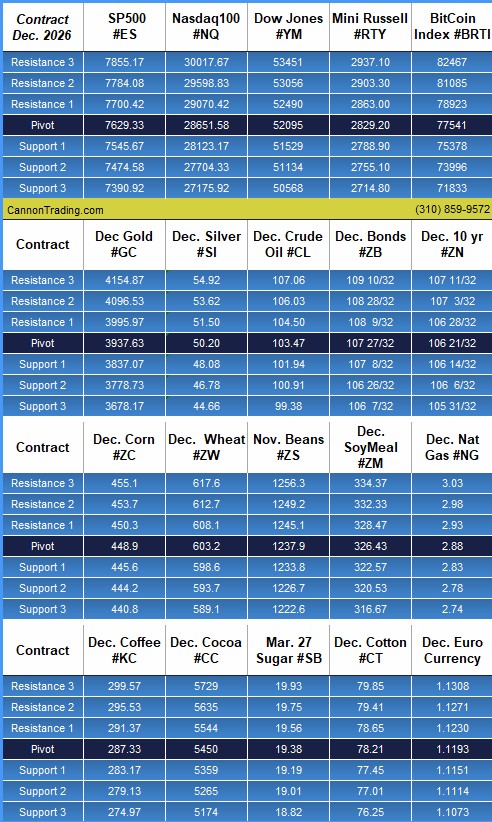
Daily Levels for Nov. 9th, 2026

a75a841f f02b 4d53 9f12 9c7114a49571

Trading Reports for Next Week

First Notice (FN), Last trading (LT) Days for the Week:

www.mrci.com

e7f59d93 efbb 4607 9d2b c80365789520

Find us on Trustpilot

4ad8134c aa57 4adb a428 7cc476773107

Trading Futures, Options on Futures, and retail off-exchange foreign currency transactions involves substantial risk of loss and is not suitable for all investors. You should carefully consider whether trading is suitable for you in light of your circumstances, knowledge, and financial resources. You may lose all or more of your initial investment. Opinions, market data, and recommendations are subject to change at any time.

Join our Private Facebook group

Subscribe to our YouTube Channel

Listen to our podcast: Subscribe on Apple, Spotify, Amazon

or wherever you listen to podcasts!

S
Facebook  Instagram  LinkedIn
S
ef3ab1c9 8d6d 4e60 a3f1 af5d9d4ecbb3

Services

Software

Tools

Community

Contact

By Cannon Operations « Back to All Posts