Daily Support & Resistance Levels

This blog provides daily support and resistance levels for major commodities, indices, and financial futures contracts, along with market outlooks and insights.

October 9, 2026
Future Trading News

Futures Market Insights for the Upcoming Week + Automated Gold System Weekly Newsletter

7cfe5b36 db9f 4933 824a 7f264613e7fe

Cannon Futures Weekly Letter

In Today’s Issue #1311

  • The Week Ahead – Earnings, CPI, PPI & More
  • Gold Automated Trading System

  • Sugar Chart & Outlook

  • Cannon Edge – Your Futures Trading Map for the week ahead!

  • Trading Levels for Next Week
  • Trading Reports for Next Week

What Futures Traders Should Watch This Week

FOMC, WASDE, Michigan, Uncertainty

By John Thorpe, Senior Broker

tradingview app

Plenty of information to stir the futures markets drink next week.

Federal Holiday reminder: Monday, October 12th is Columbus Day/Indigenous people’s day and is a Federal Holiday. Banks, post office, courts will all be closed as well is the U.S. Bond market. Because Federal offices are closed, Nat Gas storage 9:30 am CDT and Crude Oil inventory 11:00am CDT reports are both shifting to Thursday October 15th.

Our globetrotting Fed Chair and governors will be speaking during our Evening trading sessions next week. Fed Chairman Warsh will be speaking from the Bangkok Economic Festival. Please check the fed speakers calendar below for dates and times.

The Q3 earnings season begins the week of October 12, led by large banks. Constellation Brands, PepsiCo, and Delta Air Lines report earnings this week. According to FactSet, the S&P 500’s blended earnings growth rate is expected to be 29.5% year over year. Energy leads expected earnings growth, followed by technology and communication services. Meanwhile, the S&P 500 declined fractionally last week. September nonfarm payroll jobs rose by 29k, and the unemployment rate rose to 4.2%.   The Economic Data releases will also find reason to potentially roil the markets.

Economic numbers the markets will clearly have some anxiety about will be Wednesday’s early morning release of CPI followed by Thursday a.m.’s release of PPI, although the later has proven to be less impactful.

The energy’s, metals, securities, grains and interest rates are swirling in the uncertainty from a lack of resolution in the attempted unwinding of the Iranian nuclear program.

Don’t let your guard down just yet, the fog continues, tune into the Sunday evening markets to witness reactions to the weekend news streams, manufactured or true.

Plan your trade and trade your plan!

  Plan your trade and trade your plan!


Earnings Next Week:

·        Mon. Federal Holiday

·        Tue. JP Morgan,J&J, United Healthcare, Goldman Sachs, CitiGroup, Wells Fargo

·        Wed. BofA, Morgan Stanley, Fastenal

·        Thu. Schwab, Blackstone, PNCm US Bancorp, Freeport-McMoran, Marsh & McLennan, Alcoa, American Airlines

·        Fri.  Bank of New York, Travelers, Truist, M&T Bank


Fed Speakers: (all times CDT)

·        Mon. Hammack 11:50 am

·        Tues. Waller 2:45 am (from New Dehli, India on AI), Barkin 12:00pm, Collins 3:00pm, 9:10 pm Lagarde (ECB)

·        Wed. Bowman 4:40 am, Barkin 12:30 pm, Bowman 9:55pm

·        Thu.  Hammack 3:30pm, Fed Chair Warsh 10:30 pm

·        Fri.  Logan 9:00 am


Econ Data:

·        Mon.  Federal Holiday/Quiet

·        Tue. Existing Home Sales, 3 and 6 mo. Bill Auctions, API Crude stock change

·        Wed. MBA Mortgage applications, ADP, Core CPI, Redbook, Beige Book, 17-week bill auction, 5 yr note auction

·        Thu. Core PPI , NY Empire MFG., Retail Sales, Philly Fed, Cont. Jobless claims, Business Inventories, EIA Nat Gas Stocks, EIA Crude Stocks change, 4 and 8 week Bill auction,  Fed Balance sheet

·        Fri. Import/Export prices, Industrial production, Capacity Utilization, Net long term TIC flows, Baker Hughes Oil Rig Count

Brokers Trading System of the Week

NEO LVL01DELTA intraday GOLD GC

Market Sector: Metals

Markets Traded:   GC – Gold Futures

System Type: Intraday

Risk per Trade: varies

Trading Rules: Partially Disclosed

Broker’s Suggested Capital: $100,000

Developer Fee per contract: $350.00 Monthly Subscription


Get Started

Learn More

Gold system

Disclaimer The risk of trading can be substantial and each investor and/or trader must consider whether this is a suitable investment. Past performance is not necessarily indicative of future results.


IMPORTANT RISK DISCLOSURE


Futures trading is complex and carries the risk of substantial losses. It is not suitable for all investors. The ability to withstand losses and to adhere to a particular trading program in spite of trading losses are material points which can adversely affect investor returns.


The returns for trading systems listed throughout this website are hypothetical in that they represent returns in a model account. The model account rises or falls by the average single contract profit and loss achieved by clients trading actual money pursuant to the listed system’s trading signals on the appropriate dates (client fills), or if no actual client profit or loss available – by the hypothetical single contract profit and loss of trades generated by the system’s trading signals on that day in real time (real-time) less slippage, or if no real time profit or loss available – by the hypothetical single contract profit and loss of trades generated by running the system logic backwards on backadjusted data (backadjusted).


Note that the Client Fill Trades are reported across all clients utilizing the platform, across multiple brokers, and are not based solely on the performance of accounts at this brokerage.


The hypothetical model account begins with the initial capital level listed, and is reset to that amount each month. The percentage returns reflect inclusion of commissions, fees, slippage, and the cost of the system. The monthly cost of the system is subtracted from the net profit/loss prior to calculating the percentage return.


If and when a trading system has an open trade, the returns are marked to market on a daily basis, using the backadjusted data available on the day the computer backtest was performed for backtested trades, and the closing price of the then front month contract for real time and client fill trades. For a trade which spans months, therefore, the gain or loss for the month ending with an open trade is the marked to market gain or loss (the month end price minus the entry price, and vice versa for short trades).


The actual percentage gains/losses experienced by investors will vary depending on many factors, including, but not limited to: starting account balances, market behavior, the duration and extent of investor’s participation (whether or not all signals are taken) in the specified system and money management techniques. Because of this, actual percentage gains/losses experienced by investors may be materially different than the percentage gains/losses as presented on this website.


Please read carefully the CFTC required disclaimer regarding hypothetical results below. HYPOTHETICAL PERFORMANCE RESULTS HAVE MANY INHERENT LIMITATIONS, SOME OF WHICH ARE DESCRIBED BELOW. NO REPRESENTATION IS BEING MADE THAT ANY ACCOUNT WILL OR IS LIKELY TO ACHIEVE PROFITS OR LOSSES SIMILAR TO THOSE SHOWN; IN FACT, THERE ARE FREQUENTLY SHARP DIFFERENCES BETWEEN HYPOTHETICAL PERFORMANCE RESULTS AND THE ACTUAL RESULTS SUBSEQUENTLY ACHIEVED BY ANY PARTICULAR TRADING PROGRAM. ONE OF THE LIMITATIONS OF HYPOTHETICAL PERFORMANCE RESULTS IS THAT THEY ARE GENERALLY PREPARED WITH THE BENEFIT OF HINDSIGHT. IN ADDITION, HYPOTHETICAL TRADING DOES NOT INVOLVE FINANCIAL RISK, AND NO HYPOTHETICAL TRADING RECORD CAN COMPLETELY ACCOUNT FOR THE IMPACT OF FINANCIAL RISK OF ACTUAL TRADING. FOR EXAMPLE, THE ABILITY TO WITHSTAND LOSSES OR TO ADHERE TO A PARTICULAR TRADING PROGRAM IN SPITE OF TRADING LOSSES ARE MATERIAL POINTS WHICH CAN ALSO ADVERSELY AFFECT ACTUAL TRADING RESULTS. THERE ARE NUMEROUS OTHER FACTORS RELATED TO THE MARKETS IN GENERAL OR TO THE IMPLEMENTATION OF ANY SPECIFIC TRADING PROGRAM WHICH CANNOT BE FULLY ACCOUNTED FOR IN THE PREPARATION OF HYPOTHETICAL PERFORMANCE RESULTS AND ALL WHICH CAN ADVERSELY AFFECT ACTUAL TRADING RESULTS.


The information contained in the reports within this site is provided with the objective of “standarizing” trading systems account performance and is intended for informational purposes only. It should not be viewed as a solicitation for the referenced system or vendor. While the information and statistics within this website are believed to be complete and accurate, we cannot guarantee their completeness or accuracy. As past performance does not guarantee future results, these results may have no bearing on, and may not be indicative of, any individual returns realized through participation in this or any other investment.


The statistics on this page are calculated via the combination of three hypothetical data sets:


1. Backtested, 2. Tracked, and where available 3. Live.


Backtested performance is calculated by running a trading system backwards in time, and seeing what trades would have been done in the past when applied to backadjusted data. Tracked performance is calculated by running the trading system forwards on data each and every day, and logging the trades as they happen in real time day after day. Live performance is calculated by running the trading system on live tick data for actual clients and tracking the actual buy and sell prices those clients trading the system receive in their account.


We use Live results to calculate monthly returns for any month in which clients were trading for the entire month, Tracked fills for those months in which there are no client fills for the entire month, and computer generated fills for those months occurring before we loaded the system onto our trade servers. The results are hypothetical in that they represent returns in a model account. The model account rises or falls by the single contract profit and loss achieved by the system in whichever data set is available. The hypothetical model account begins with the Sugested Capital listed, and is reset to that amount each month. The percentage returns reflect inclusion of commissions, fees, slippage, and the cost of the system. The commission, slippage, fees, and monthly system costs are subtracted from the net profit/loss prior to calculating the percentage return.


Please note that the method of resetting the model account to the initial value at the start of each month creates a track record which is representative of the simple returns for each time period, but that it does not, by definition, show how returns would compound over time. Should an investor following said program trade a single contract indefinitely without also resetting their account to the initial capital amount each month, their performance will differ from the performance detailed herein.

Youtube trading system

Get a daily market edge—support & resistance levels plus key market-moving insights.

pre market briefing

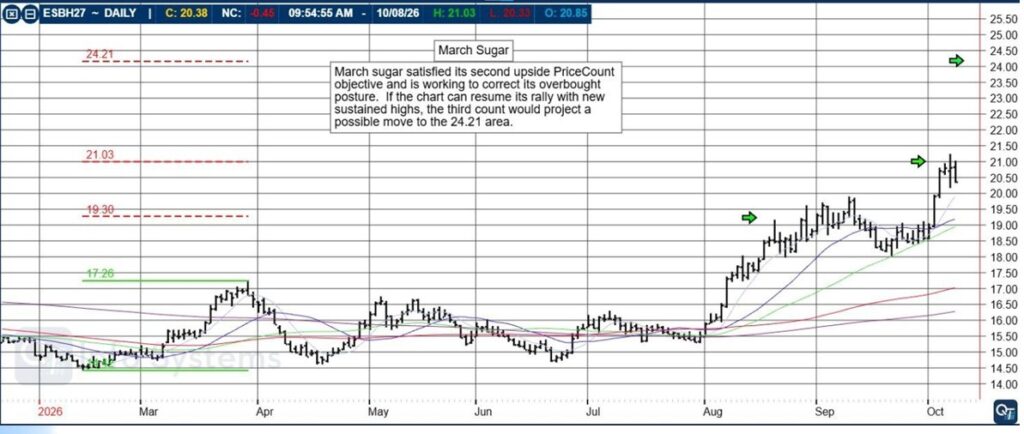
March Sugar

March Sugar satisfied its second upside PriceCount objective and is working to correct its overbought posture. If the chart can resume its rally with new sustained highs, the third count would project a possible move to the 24.21 area. 


Schedule a one on one consultation with a licensed series 3 broker HERE

March Sugar

The PriceCount study is a tool that can help to project the distance of a move in price. The counts are not intended to be an ‘exact’ science but rather offer a target area for the four objectives which are based off the first leg of a move with each subsequent count having a smaller percentage of being achieved.

It is normal for the chart to react by correcting or consolidating at an objective and then either resuming its move or reversing trend. Best utilized in conjunction with other technical tools, PriceCounts offer one more way to analyze charts and help to manage your positions and risk.

Learn more at https://www.qtinfo.com/analysis/qt-chart-of-the-day/

Trading in futures, options, securities, derivatives or OTC products entails significant risks which must be understood prior to trading and may not be appropriate for all investors. Past performance of actual trades or strategies is not necessarily indicative of future results.

FREE TRIAL TO QT MARKET Center – Access to analysis, tools, news & Much more!

Highly recommended for HEDGERS!

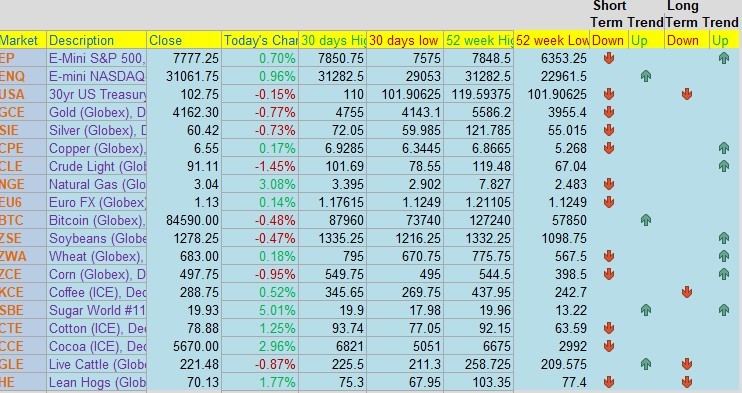
Cannon Edge — Your Daily Futures Insight for the Next Trading Day! Cannon Edge for Oct. 12th 2026

Edge 10.09

Cannon Edge is our new daily feature designed to give traders a fast, actionable overview of key futures markets. Each post delivers:

  • Current price and daily % change
  • 30‑day and 52‑week highs/lows
  • PROPRIETARY Short‑term and long‑term trend signals
  • Coverage across equity indices, metals, energies, currencies, and ags

Whether you’re scanning for breakout setups, trend reversals, or just staying informed — Cannon Edge puts the data in your hands before the open.

Built for speed. Backed by insight. Powered by CQG.

Would you like to get weekly updates on real-time, results of Automated trading systems ?

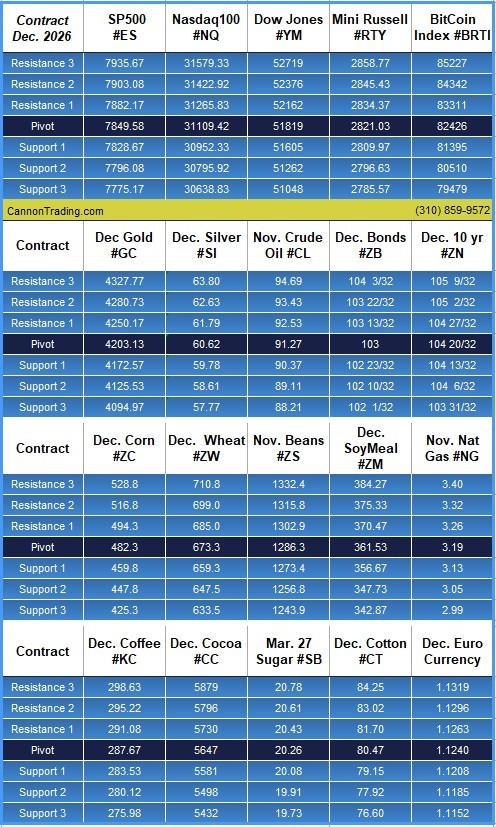
Daily Levels for Oct. 12th, 2026

Levels 10.09

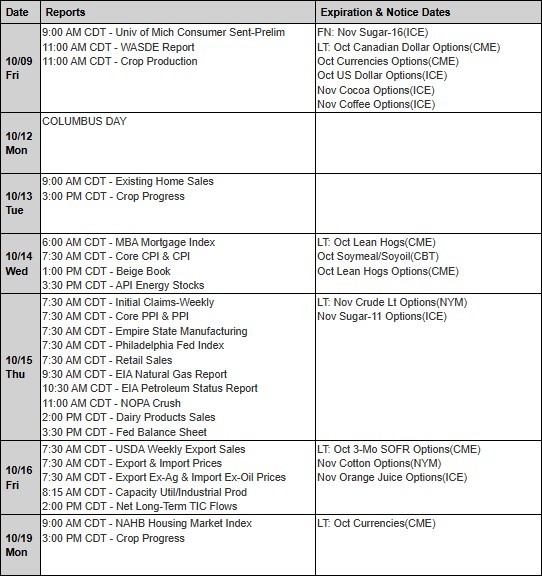
Trading Reports for Next Week

First Notice (FN), Last trading (LT) Days for the Week:

www.mrci.com

Reports 10.09

Find us on Trustpilot

4ad8134c aa57 4adb a428 7cc476773107

Trading Futures, Options on Futures, and retail off-exchange foreign currency transactions involves substantial risk of loss and is not suitable for all investors. You should carefully consider whether trading is suitable for you in light of your circumstances, knowledge, and financial resources. You may lose all or more of your initial investment. Opinions, market data, and recommendations are subject to change at any time.

Join our Private Facebook group

Subscribe to our YouTube Channel

Listen to our podcast: Subscribe on Apple, Spotify, Amazon

or wherever you listen to podcasts!

S
Facebook  Instagram  LinkedIn
S
ef3ab1c9 8d6d 4e60 a3f1 af5d9d4ecbb3

Services

Software

Tools

Community

Contact