Futures: Rotation, Not Retreat PLUS: PHLX/KOSPI/SOX, 3:2:1 Crack Spread, Levels, Reports; Your 7 Important Can’t-Miss Need-To-Knows for Trading Futures on July 7th, 2026

9dc1e02e d5f7 4ff4 abf7 1df60775f196

Futures: Rotation, Not Retreat

By Eli Levy, Senior Analyst & Series 3 Broker
futures

The New Quarter Begins

The new quarter arrived with a jolt. After a first half where the AI and semiconductor trade did much of the heavy lifting, this week saw that same corner of the market hit with selling pressure and real volatility — and notably, it happened even as oil prices eased and yields drifted lower. The pressure wasn’t about the macro backdrop turning hostile; it was about money in motion, rotating out of the most crowded trades and looking for a home elsewhere.

PHLX/KOSPI/SOX

The numbers tell the story. The PHLX Semiconductor Index (SOX) fell roughly 12% over just two sessions, pressured in part by a sharp overnight drop in Korea’s KOSPI, which shed 7.89% in one session. On one side of the coin, this looks like a long-overdue mean reversion: the SOX rallied nearly 100% in the first six months of the year, a parabolic run that arguably needed to cool.

Mircron

Micron’s reaction last week was a tell — the stock traded poorly on massive volume despite reporting, and the optical names tied to the AI build-out have been rolling over alongside it. On the other side of the coin, sharp pullbacks inside a longer-term uptrend have repeatedly turned out to be buying opportunities, and there’s a case that this one proves no different.

Healthcare/Insurance

What’s keeping the mood constructive is where the money is going. Rather than fleeing the market entirely, it’s rotating beneath the surface. Healthcare is breaking out of a five-year trading range, insurance is emerging from an 18-month base, and REITs — flat for the better part of five or six years — are being watched as a possible next leg. As long as capital rotating out of momentum keeps finding a home, the pullback reads as healthy churn rather than a broad unwind. The economic data and growth forecasts remain strong, the broadening looks like it’s still underway, and July seasonality has historically favored the bulls.

US – Iran Relations

Overseas and in Washington, the picture is mixed but not alarming. The U.S.–Iran ceasefire is not going smoothly, and the status of the Strait of Hormuz remains unclear, yet oil has held below $70 a barrel and markets remain hopeful of a resolution. At the ECB forum, Fed Chair Kevin Warsh stayed tight-lipped on forward guidance while reiterating his commitment to getting inflation back to the 2% target. With next week light on both the economic and earnings calendars, near-term direction can likely be steered by technicals, Middle East headlines, oil, and yields rather than by fresh data.

READ THE REST and SEE CHARTS

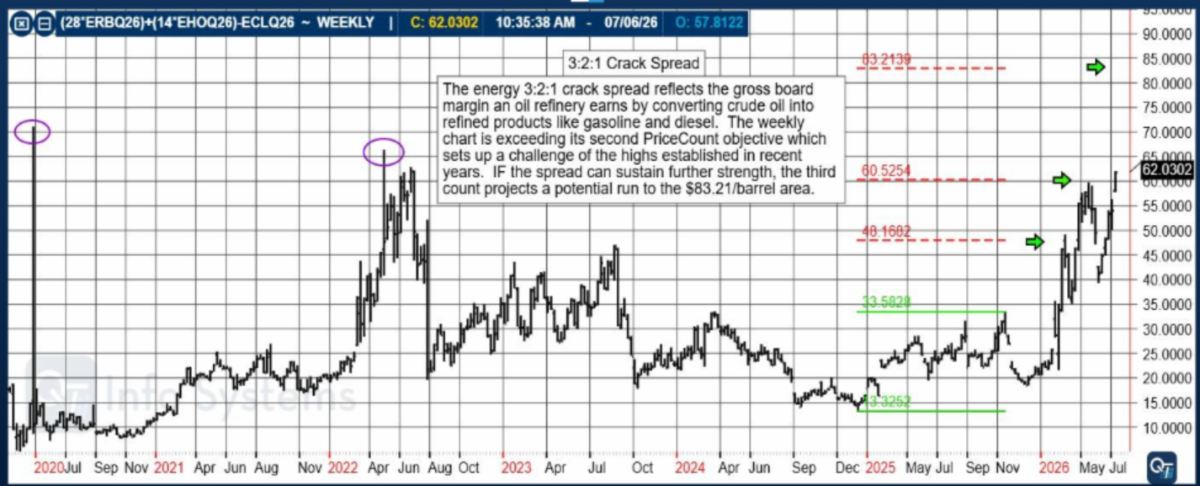
3:2:1 Crack Spread

The 3-2-1 Crack Spread approximates the value of crude oil inputs and product outputs – in effect an indicator of refinery profitability. The 3-2-1 Crack spread approximates a theoretical refinery crude yield that produces two barrels of gasoline and one barrel of diesel for every three barrels of crude input. In other words, the simplified refinery yield implied by this calculation is two-thirds gasoline, one-third diesel. It is calculated in $/bbl.

Here is the simple mathematical formula:

https://www.cmegroup.com/tools-information/calc_crack.html

3 contracts of WTI Crude, 2 Contracts RBOB, 1 Contract HO (diesel)

783b3cb3 0ca5 4161 94e9 4136377a0723

The PriceCount study is a tool that can help to project the distance of a move in price. The counts are not intended to be an ‘exact’ science but rather offer a target area for the four objectives which are based off the first leg of a move with each subsequent count having a smaller percentage of being achieved.

It is normal for the chart to react by correcting or consolidating at an objective and then either resuming its move or reversing trend. Best utilized in conjunction with other technical tools, PriceCounts offer one more way to analyze charts and help to manage your positions and risk.

Learn more at www.qtchartoftheday.com

Trading in futures, options, securities, derivatives or OTC products entails significant risks which must be understood prior to trading and may not be appropriate for all investors. Past performance of actual trades or strategies is not necessarily indicative of future results.

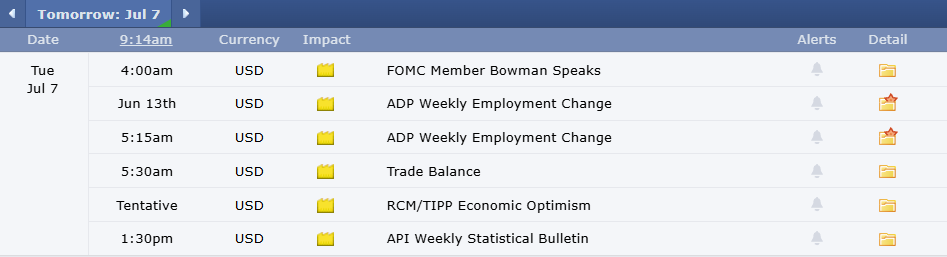
Economic Reports

provided by: ForexFactory.com

All times are Central Time ( Chicago)

3ea0e274 2eb0 4d86 89c4 ea13904d6731

Find us on Trustpilot

41a3c910 28d6 4126 946b 6659bb02ae4d

Trading Futures, Options on Futures, and retail off-exchange foreign currency transactions involves substantial risk of loss and is not suitable for all investors. You should carefully consider whether trading is suitable for you in light of your circumstances, knowledge, and financial resources. You may lose all or more of your initial investment. Opinions, market data, and recommendations are subject to change at any time.

Join our Private Facebook group

Subscribe to our YouTube Channel

Listen to our podcast: Subscribe on AppleSpotify, Amazon

or wherever you listen to podcasts!

S
Facebook  Instagram  LinkedIn
S
ef3ab1c9 8d6d 4e60 a3f1 af5d9d4ecbb3
Services
Software
Tools
Community
Contact