Market Hours, Trading Sessions & Liquidity Windows

When the Clock Rules the Tape
A practical guide to the 23-hour futures day, the handoffs between global venues, and the liquidity pockets that quietly determine whether your fills are efficient or expensive.
Spot equity traders live in a six-and-a-half-hour world. Futures traders live in a nearly continuous one.
CME Group’s Globex platform operates approximately 23 hours per day, from Sunday evening through Friday afternoon, with a one-hour daily maintenance break. ICE, Eurex, and Asian exchanges maintain their own schedules, creating a global futures marketplace that functions more like a relay race than a sprint.
But “open 23 hours” does not mean “equally tradable for 23 hours.”
Liquidity, spreads, slippage, and gap risk vary dramatically throughout the trading day. Consistently successful traders treat time as a first-class variable alongside price and position size.
In many cases, the difference between a favorable trading environment and a dangerous one is simply 30 to 60 minutes on the clock.
The Global Futures Clock
The modern futures market operates through three major regional liquidity centers:
- Asia-Pacific
- Europe
- North America
Each session has its own participants, news flow, and volatility profile.
Overnight positioning in Tokyo and Singapore often becomes the setup for London. London’s activity then creates the backdrop for the New York cash open.
All times below are Eastern Time (ET).
SessionHours (ET)Primary ParticipantsLiquidityAsia-Pacific6:00 PM – 3:00 AMJapanese, Australian, Chinese markets, FX flowsLow-MediumLondon/Europe3:00 AM – 8:00 AMEuropean banks, Bunds, Euro Stoxx, Brent tradersMediumPre-Cash U.S.8:00 AM – 9:30 AMEconomic releases, earnings reactionsMedium-HighU.S. Regular Trading Hours (RTH)9:30 AM – 4:00 PMFull institutional participationPeakU.S. Late Session4:00 PM – 6:00 PMPosition squaring, earnings releasesLow-MediumCME Maintenance Break5:00 PM – 6:00 PMTrading haltedClosed
Important: Exact trading hours vary by contract. Always verify with the exchange product specifications before trading.
RTH vs. ETH: The Distinction That Governs Charts
One of the first concepts futures traders encounter is the difference between:
- RTH (Regular Trading Hours)
- ETH (Extended Trading Hours)
The choice affects chart structure, support and resistance levels, gap analysis, and overall market interpretation.
What Is RTH?
For equity index futures such as ES, NQ, YM, and RTY:
9:30 AM to 4:00 PM ET
This mirrors the NYSE cash session and represents the period when institutional participation is highest.
What Is ETH?
The full electronic Globex session:
Sunday 6:00 PM ET through Friday 5:00 PM ET, excluding the daily maintenance halt from 5:00 PM to 6:00 PM ET.
ETH captures every overnight tick and global market reaction.
Why Institutions Prefer RTH Charts
Institutional traders focus on RTH because that is where the majority of meaningful price discovery occurs.
Volume during cash-market hours is often three to five times higher than overnight volume in equity index futures.
As a result:
- RTH highs and lows are viewed as key market reference points.
- Overnight levels provide context but generally carry less significance.
- Most professional market analysis references prior RTH highs, lows, and closes.
Many traders keep both RTH and ETH charts available:
- RTH for market structure and key levels.
- ETH for overnight context and extreme price action.
The Five Liquidity Windows Every Futures Trader Should Know
Liquidity is not evenly distributed throughout the trading day.
Certain windows consistently provide deeper order books, tighter spreads, and better execution.
Others tend to produce poor fills and deceptive price action.
1. London Open Window (3:00 AM to 5:00 AM ET)
Liquidity: Medium
As European trading desks come online, volume increases substantially compared with overnight Asian hours.
Key products include:
- Bund futures
- Euro Stoxx 50
- Brent crude
- EUR/USD
U.S. equity index futures become more active but remain below U.S. daytime liquidity levels.
2. Major U.S. Economic Releases (8:30 AM ET)
Liquidity Burst
Critical reports released at this time include:
- CPI
- PPI
- Nonfarm Payrolls (NFP)
- GDP
- Retail Sales
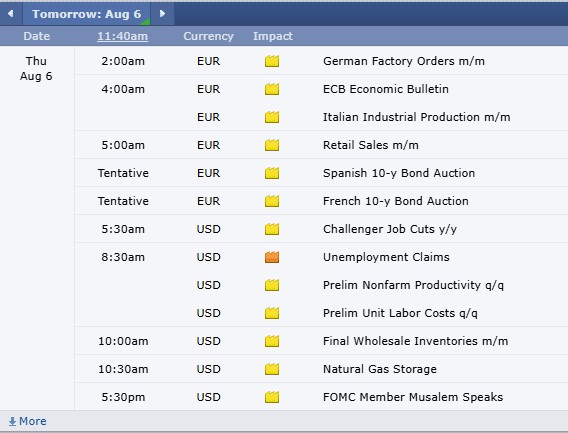
- Jobless Claims
Volume and volatility can spike dramatically within seconds.
Expect temporary spread expansion followed by rapid repricing.
3. Opening Hour / Initial Balance (9:30 AM to 10:30 AM ET)
Liquidity: Peak
For equity index futures, this is generally the most liquid hour of the day.
Drivers include:
- Institutional participation
- Opening auction flows
- Market-on-open orders
- Retail activity
The first hour frequently establishes the day’s Initial Balance and often defines the session’s directional bias.
4. Lunch Lull (12:00 PM to 1:30 PM ET)
Liquidity: Thin
New York desks become less active and overall participation declines.
Characteristics include:
- Reduced volume
- Failed breakouts
- Choppy range-bound action
- Increased stop hunting
Many discretionary traders avoid initiating positions during this window.
5. Closing Hour and MOC Imbalances (3:00 PM to 4:00 PM ET)
Liquidity: Peak
The final hour of the session produces another major surge in activity.
Institutions rebalance portfolios and respond to:
- Market-on-close (MOC) imbalances
- Index fund flows
- End-of-day position adjustments
Price movement during the final minutes often reflects genuine institutional intent.
The Sunday Open and Weekend Gap Risk
Globex reopens every Sunday at 6:00 PM ET.
This reopening is one of the most overlooked risk events in futures trading.
During weekends, markets accumulate:
- Geopolitical developments
- Corporate news
- Central-bank commentary
- Global economic events
When trading resumes, all that information is incorporated simultaneously into a relatively thin market environment.
In quiet weeks, the gap may be negligible.
During major news events, the Sunday open can produce price moves exceeding the previous week’s range within the first half hour.
Product-Specific Trading Sessions
Equity Index Futures
ES, NQ, YM, RTY
Best liquidity:
- 9:30 AM to 4:00 PM ET
- 8:30 AM economic releases
- Closing hour
The lunch lull remains significant.
DAX (FDAX) and Euro Stoxx (FESX)
Best liquidity:
European cash hours dominate trading activity.
Nikkei Futures
Activity concentrates around:
- Osaka trading hours
- CME overnight sessions
Liquidity migrates between venues throughout the day.
Interest Rate Futures
Treasury Futures (ZN, ZB, ZF, ZT)
Peak trading:
Economic data releases at 8:30 AM are particularly important.
SOFR Futures
Highest activity occurs:
- During U.S. trading hours
- Around Fed meetings
- During CPI and NFP releases
Energy Futures
Crude Oil (CL)
Peak activity:
Special attention:
- API Report: Tuesday 4:30 PM ET
- EIA Inventory Report: Wednesday 10:30 AM ET
Natural Gas (NG)
The weekly EIA Storage Report at 10:30 AM ET on Thursday is typically the most important event.
Metals
Gold (GC) and Silver (SI)
Three major activity centers exist:
- Asian trading
- London market activity
- U.S. trading hours
Unlike many products, overnight trading remains relatively active.
Copper (HG)
Strong participation during:
- Asian market hours
- London Metal Exchange hours
- U.S. session overlap
Agricultural Futures
Corn (ZC), Soybeans (ZS), Wheat (ZW)
Major event:
- USDA WASDE Reports at 12:00 PM ET
These reports can redefine market expectations immediately.
Livestock (LE, HE)
Primarily active during pit trading hours:
9:30 AM to 1:05 PM ET
Outside those hours, liquidity declines substantially.
Holiday Trading Considerations
Futures markets follow schedules that often differ from stock markets.
Always review exchange holiday calendars in advance.
Key dates include:
- New Year’s Day
- Good Friday
- Memorial Day
- Independence Day
- Labor Day
- Thanksgiving
- Christmas
Early-close sessions:
- Christmas Eve
- New Year’s Eve
- Day After Thanksgiving
Liquidity often deteriorates well before official closing times.
Quarterly futures expiration dates in March, June, September, and December can also create unusually high volume and volatility.
The futures market’s nearly 24-hour schedule is both an advantage and a challenge.
It allows traders to react to global developments in real time, but it also tempts them into trading during periods when liquidity is poor and statistical edge is minimal.
Professional futures traders treat time as a filter. They understand which sessions fit which strategies, when liquidity is strongest, and when standing aside is the highest-probability decision.
Mastering market sessions and liquidity windows can eliminate one of the largest sources of unnecessary trading friction and improve overall execution quality.
Need help evaluating different systems? get some insight from an experienced series 3 broker?
+310 859 9572
|