Support & Resistance Levels

This Blog provides futures market outlook for different commodities and futures trading markets, mostly stock index futures, as well as support and resistance levels for Crude Oil futures, Gold futures, Euro currency and others. At times the daily trading blog will include educational information about different aspects of commodity and futures trading.

Trading Levels and Economic Reports July 17, 2013

Connect with Us! Use Our Futures Trading Levels and Economic Reports RSS Feed.

Like us on FacebookFollow us on TwitterView our profile on LinkedInFind us on Google+Cannon Trading Futures Trading Resistance & Support Levels and Economic ReportsFind us on Yelp

1. Market Commentary
2. Futures Support and Resistance Levels – S&P, Nasdaq, Dow Jones, Russell 2000, Dollar Index
3. Commodities Support and Resistance Levels – Gold, Euro, Crude Oil, T-Bonds
4. Commodities Support and Resistance Levels – Corn, Wheat, Beans, Silver
5. Futures Economic Reports for Wednesday July 17, 2013

Hello Traders,

For 2013 I would like to wish all of you discipline and patience in your trading! 


In today’s post I actually want to share how I create volume charts using Sierra Charts (also known as AT charts). Email me to find out how you can have Sierra Charts for free!

I like to use volume charts for futures trading when it comes to intraday or high frequency trading. So if you are an active trader or a scalper, you may want to explore the use of volume charts and see if you can find an edge.


My theory is that when it comes to short term day trading, volume is much more important than time, hence the use of volume bars. I use bars of between 1,000 to 18,000 contracts traded (pending the specific market, based on recent volatility, trade volume and a few other factors). That means that instead of bars completing based on time frame (i.e. 1 minute or 15 minutes etc.), we use volume instead of time. So each time X,000 contracts traded, a new bar will complete. When the specific market has high volume and is moving fast, the bars will complete faster. When market is in low volume without much action, the bars will complete slower.


For me personally, this has helped getting signals ahead of time when there is fast action in the market and avoiding false signals when volume is low.


So in Sierra Charts I right click inside the chart and choose chart settings.


In chart settings I use the drop down menu under the Bar Period like in the screen shot below.


739


I then specify the amount of volume I want per bar. (I normally look at average daily volume and divide that by 20) and click apply.


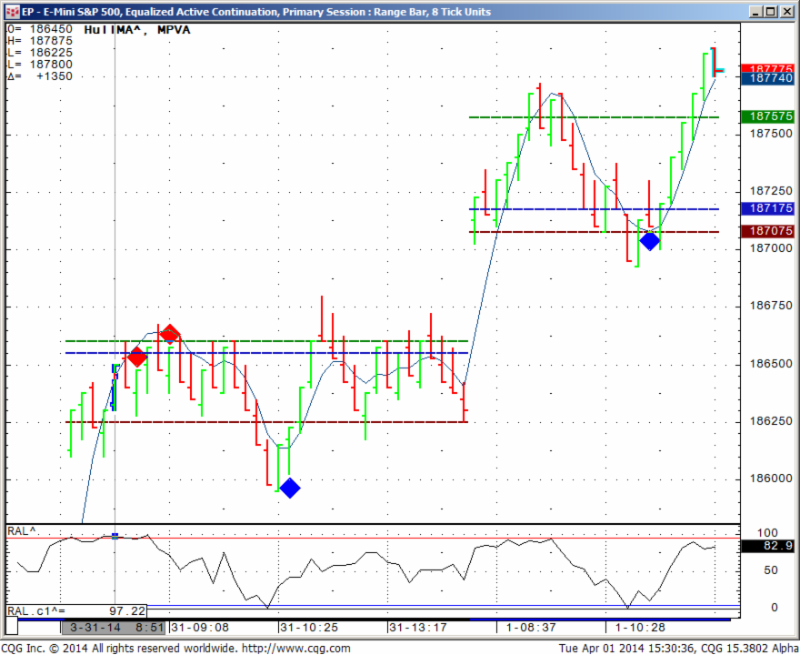
Below you will see my intraday chart for the mini SP from today, using 10000 volume charts. That means that each time 10000 contracts traded, a new bar will start.


Hope this helps and if you have any questions, feel free to email me.


image.php?l=1374004498440


You like the information we share? We would appreciate your positive reviews on Google+ , Facebook, Yelp etc…use the icons below to share, recommend, review us and more!

Like us on FacebookFollow us on TwitterView our profile on LinkedInFind us on Google+Cannon Trading Futures Trading Resistance & Support Levels and Economic ReportsFind us on Yelp

If you like the information we share? We would appreciate your positive reviews on our new yelp!!

GOOD TRADING


Trading Futures, Options on Futures, and retail off-exchange foreign currency transactions involves substantial risk of loss and is not suitable for all investors. You should carefully consider whether trading is suitable for you in light of your circumstances, knowledge, and financial resources. You may lose all or more of your initial investment. Opinions, market data, and recommendations are subject to change at any time.


Futures Trading Levels

For complete contract specifications for the futures markets listed above click here!

5. Economic Reports

source:http://www.forexfactory.com/calendar.php

All times are Eastern time Zone (EST)

Date 3:42pm Currency Impact Detail Actual Forecast Previous Graph
WedJul 17  Tentative EUR German 10-y Bond Auction 1.55|1.5
8:30am USD Building Permits 1.00M 0.99M
USD Housing Starts 0.96M 0.91M
10:00am USD Fed Chairman Bernanke Testifies
10:30am USD Crude Oil Inventories -1.9M -9.9M
12:30pm USD FOMC Member Raskin Speaks
2:00pm USD Beige Book

This is not a solicitation of any order to buy or sell, but a current market view provided by Cannon Trading Inc. Any statement of facts herein contained are derived from sources believed to be reliable, but are not guaranteed as to accuracy, nor they purport to be complete. No responsibility is assumed with respect to any such statement or with respect to any expression of opinion herein contained. Readers are urged to exercise their own judgment in trading

Trading Levels and Economic Reports for July 16, 2013

Connect with Us! Use Our Futures Trading Levels and Economic Reports RSS Feed.

Like us on FacebookFollow us on TwitterView our profile on LinkedInFind us on Google+Cannon Trading Futures Trading Resistance & Support Levels and Economic ReportsFind us on Yelp

1. Market Commentary
2. Futures Support and Resistance Levels – S&P, Nasdaq, Dow Jones, Russell 2000, Dollar Index
3. Commodities Support and Resistance Levels – Gold, Euro, Crude Oil, T-Bonds
4. Commodities Support and Resistance Levels – Corn, Wheat, Beans, Silver
5. Futures Economic Reports for Tuesday July 13, 2013

Hello Traders,

For 2013 I would like to wish all of you discipline and patience in your trading! 


Stocks continue to move higher BUT on very low summer type of trading volume.
For most of you who are daytraders, the main question should be how does that changes the “personality ” of the trading day?
Are we back to narrower trading days with lower volatility? or is this just a break from the more volatile/wider trading ranges we witnessed when the market was moving lower?
Are we back to buying intraday dips and the market will continue to rally?
For those of you who are swing traders, the main question is what are the extended targets for this rally and is this a short covering rally from the recent sell off or a new leg up?

Obviously the answers are unknown at this point but knowing what to consider while trading can be helpful by itself.
Daily chart of the mini SP 500 along with potential extensions to the upside and possible support levels below for your review


mini sp daily chart Continue reading “Trading Levels and Economic Reports for July 16, 2013”

Futures Trading Levels and Economic Reports for July 12, 2013

Connect with Us! Use Our Futures Trading Levels and Economic Reports RSS Feed.

Like us on FacebookFollow us on TwitterView our profile on LinkedInFind us on Google+Cannon Trading Futures Trading Resistance & Support Levels and Economic ReportsFind us on Yelp

1. Market Commentary
2. Futures Support and Resistance Levels – S&P, Nasdaq, Dow Jones, Russell 2000, Dollar Index
3. Commodities Support and Resistance Levels – Gold, Euro, Crude Oil, T-Bonds
4. Commodities Support and Resistance Levels – Corn, Wheat, Beans, Silver
5. Futures Economic Reports for Friday July 12, 2013

Hello Traders,

For 2013 I would like to wish all of you discipline and patience in your trading! 


Thought of the day for you….


Many ways to lose money….very few ways to make money.


1. Have a high winning ratio, allow for bigger stops but the higher winning ratio hopefully translates into higher average winning trades than the average losing trades

2. Have more losers than winners but let winners run in order to have quite a bit larger average winners than average losers.

3. Make sure that when it all said and done the math makes sense….if its on a daily basis, weekly or monthly – as a trader you need to set parameters for targets, stops NOT just on per trade basis but on a daily basis, weekly basis etc.


I wrote a good article about this subject called survivor daytrader. If you like a copy, please email me with the following:

Name:

Email:

Client: yes or no

Current trading software:

And I will be happy to email you the PDF file.

Futures Trading Levels and Economic Reports for July 11, 2013

Connect with Us! Use Our Futures Trading Levels and Economic Reports RSS Feed.

Like us on FacebookFollow us on TwitterView our profile on LinkedInFind us on Google+Cannon Trading Futures Trading Resistance & Support Levels and Economic ReportsFind us on Yelp

1. Market Commentary
2. Futures Support and Resistance Levels – S&P, Nasdaq, Dow Jones, Russell 2000, Dollar Index
3. Commodities Support and Resistance Levels – Gold, Euro, Crude Oil, T-Bonds
4. Commodities Support and Resistance Levels – Corn, Wheat, Beans, Silver
5. Futures Economic Reports for Thursday July 11, 2013

Hello Traders,

For 2013 I would like to wish all of you discipline and patience in your trading! 

SP 500 still trying to decide which way to go and maybe by the time you read this email , it already decided as Bernanke is scheduled to speak any minute.

Daily chart for your review below.

Mini SP 500 Futures Daily Chart

Continue reading “Futures Trading Levels and Economic Reports for July 11, 2013”

Futures Trading Levels and Economic Reports for July 10, 2013

Connect with Us! Use Our Futures Trading Levels and Economic Reports RSS Feed.

Like us on FacebookFollow us on TwitterView our profile on LinkedInFind us on Google+Cannon Trading Futures Trading Resistance & Support Levels and Economic ReportsFind us on Yelp

1. Market Commentary
2. Futures Support and Resistance Levels – S&P, Nasdaq, Dow Jones, Russell 2000, Dollar Index
3. Commodities Support and Resistance Levels – Gold, Euro, Crude Oil, T-Bonds
4. Commodities Support and Resistance Levels – Corn, Wheat, Beans, Silver
5. Futures Economic Reports for Wednesday July 10, 2013

Hello Traders,

For 2013 I would like to wish all of you discipline and patience in your trading! 

 Some big moves took place while I was away. The two that are of most interest to me, are the stock index and crude oil futures.

Stocks had an impressive rebound following the Nikkei foot steps.

The market is now against strong resistance levels and it will be interesting to see if we can break above 1656 followed by 1680 or if the selling pressure will resume. My longer term outlook is for lower prices but I will let price action show me which side of the market has better probabilities.

Daily chart of the mini SP for your review below:

mini SP daily chart


Crude Oil had a big UPSIDE move, mostly on political unrest in middle east but this market is also trading against important levels with today’s high breaking the previous high from Sept. of 2012 .
While I am sure we will see big moves both ways in the volatile crude market, price action suggests more upside in the medium/ longer term based on my personal view of the charts.

Weekly chart for your review below:


weekly crude oil chart


You like the information we share? We would appreciate your positive reviews on Google+ , Facebook, Yelp etc…use the icons below to share, recommend, review us and more!

Like us on FacebookFollow us on TwitterView our profile on LinkedInFind us on Google+Cannon Trading Futures Trading Resistance & Support Levels and Economic ReportsFind us on Yelp

If you like the information we share? We would appreciate your positive reviews on our new yelp!!

GOOD TRADING


Trading Futures, Options on Futures, and retail off-exchange foreign currency transactions involves substantial risk of loss and is not suitable for all investors. You should carefully consider whether trading is suitable for you in light of your circumstances, knowledge, and financial resources. You may lose all or more of your initial investment. Opinions, market data, and recommendations are subject to change at any time.


Futures Trading Levels

Contract Sept. 2013  SP500 (big & Mini) Nasdaq100 (big & Mini) Dow Jones (big & Mini) Mini Russell Dollar Index
Resistance 3 1665.00 3014.50 15369 1030.90 85.74
Resistance 2 1657.00 2999.75 15313 1024.20 85.35
Resistance 1 1651.75 2988.50 15273 1020.00 85.08
Pivot 1643.75 2973.75 15217 1013.30 84.70
Support 1 1638.50 2962.50 15177 1009.10 84.43
Support 2 1630.50 2947.75 15121 1002.40 84.04
Support 3 1625.25 2936.50 15081 998.20 83.77
Contract August Gold Sept. Silver August Crude Oil Sept. Bonds  Sept. Euro
Resistance 3 1286.0 2002.5 106.41 134 10/32 1.3020
Resistance 2 1272.4 1975.5 105.26 134  2/32 1.2960
Resistance 1 1259.3 1947.0 104.62 133 25/32 1.2874
Pivot 1245.7 1920.0 103.47 133 17/32 1.2814
Support 1 1232.6 1891.5 102.83 133  8/32 1.2728
Support 2 1219.0 1864.5 101.68 133 1.2668
Support 3 1205.9 1836.0 101.04 132 23/32 1.2582
Contract Dec Corn Sept. Wheat Nov.Beans Dec. SoyMeal Dec. bean Oil
Resistance 3 543.2 682.8 1300.58 399.70 46.69
Resistance 2 533.1 681.2 1290.42 391.70 46.40
Resistance 1 527.4 679.3 1283.33 385.30 46.18
Pivot 517.3 677.7 1273.17 377.30 45.89
Support 1 511.7 675.8 1266.1 370.9 45.7
Support 2 501.6 674.2 1255.92 362.90 45.38
Support 3 495.9 672.3 1248.83 356.50 45.16
For complete contract specifications for the futures markets listed above click here!

5. Economic Reports

source:http://www.forexfactory.com/calendar.php

All times are Eastern time Zone (EST)

Date 3:53pm Currency Impact Detail Actual Forecast Previous Graph
WedJul 10  2:00am EUR German Final CPI m/m 0.1% 0.1%
2:45am EUR French Industrial Production m/m -0.5% 2.2%
4:00am EUR Italian Industrial Production m/m 0.4% -0.3%
10:00am USD Wholesale Inventories m/m 0.3% 0.2%
10:30am USD Crude Oil Inventories -2.9M -10.3M
1:00pm USD 10-y Bond Auction 2.21|2.5
2:00pm USD FOMC Meeting Minutes
4:10pm USD Fed Chairman Bernanke Speaks


This is not a solicitation of any order to buy or sell, but a current market view provided by Cannon Trading Inc. Any statement of facts herein contained are derived from sources believed to be reliable, but are not guaranteed as to accuracy, nor they purport to be complete. No responsibility is assumed with respect to any such statement or with respect to any expression of opinion herein contained. Readers are urged to exercise their own judgment in trading

Futures Trading Levels and Economic Reports for July 3rd, 2013

Connect with Us! Use Our Futures Trading Levels and Economic Reports RSS Feed.

Like us on FacebookFollow us on TwitterView our profile on LinkedInFind us on Google+Cannon Trading Futures Trading Resistance & Support Levels and Economic ReportsFind us on Yelp

1. Market Commentary
2. Futures Support and Resistance Levels – S&P, Nasdaq, Dow Jones, Russell 2000, Dollar Index
3. Commodities Support and Resistance Levels – Gold, Euro, Crude Oil, T-Bonds
4. Commodities Support and Resistance Levels – Corn, Wheat, Beans, Silver
5. Futures Economic Reports for Wednesday July 3, 2013

Hello Traders,

For 2013 I would like to wish all of you discipline and patience in your trading! 


 There wont be any blog commentary until July 8th as I am taking a family vacation.

Trading levels will be published daily.

Wishing all of you good trading!

Continue reading “Futures Trading Levels and Economic Reports for July 3rd, 2013”

Fourth of July Futures Trading Schedule

Fourth of July Day Holiday Schedule

for CME / Globex & ICE Exchanges


CME Group


CME & CBOT Equity Products


Wednesday, July 3

12:15 P.M. CT –Early close

5:00 P.M. CT –Regular open for trade date Friday, July 5*

Thursday, July 4

7:15 A.M.  CT – Regular open – USD – Ibovespa Futures open for trade date Friday, July 5

10:30 A.M.  CT – Trading halt

Order entry, modification and cancellation allowed

5:00 P.M. CT – Halted products resume trading

Friday, July 5

7:15 A.M.  CT – Regular open – USD – Ibovespa Futures

4:15 P.M. CT – Regular close

Continue reading “Fourth of July Futures Trading Schedule”

Futures Trading Levels and Economic Reports for June 28, 2013

Connect with Us! Use Our Futures Trading Levels and Economic Reports RSS Feed.

Like us on FacebookFollow us on TwitterView our profile on LinkedInFind us on Google+Cannon Trading Futures Trading Resistance & Support Levels and Economic ReportsFind us on Yelp

1. Market Commentary
2. Futures Support and Resistance Levels – S&P, Nasdaq, Dow Jones, Russell 2000, Dollar Index
3. Commodities Support and Resistance Levels – Gold, Euro, Crude Oil, T-Bonds
4. Commodities Support and Resistance Levels – Corn, Wheat, Beans, Silver
5. Futures Economic Reports for Friday June 28, 2013

Hello Traders,

For 2013 I would like to wish all of you discipline and patience in your trading! 


 There wont be any blog commentary until July 8th as I am taking a family vacation.

Trading levels will be published daily.

Wishing all of you good trading!

Continue reading “Futures Trading Levels and Economic Reports for June 28, 2013”