Daily Support & Resistance Levels

This blog provides daily support and resistance levels for major commodities, indices, and financial futures contracts, along with market outlooks and insights.

October 21, 2026
Corn Futures

The Trader’s Important Corn Futures Trading Outlook | October 22nd, 2026

9dc1e02e d5f7 4ff4 abf7 1df60775f196

At A Glance Levels

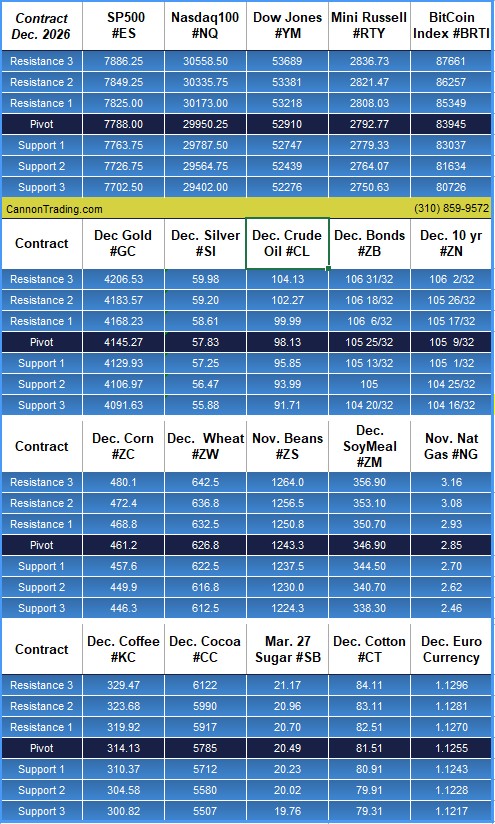
Instrument S2 S1 Pivot R1 R2

Gold (GC)

— Dec. (#GC)

4106.97 4129.93 4145.27 4168.23 4183.57

Silver (SI)

— Dec. (#SI)58.79

56.47 57.25 57.83 58.61 59.20

Crude Oil (CL)

— Dec. (#CL)

93.99 95.85 98.13 99.99 102.27

 Dec. Bonds (ZB)

— Dec. (#ZB)

105 105 13/32 105 25/32 106 6/32 106 18/32

Why Day Traders Should Keep More Than One Market on the Radar

traders

Traders’ Mistakes

One of the biggest mistakes active traders make is becoming too focused on a single market. Today’s trading environment is highly interconnected, and volatility often rotates from one sector to another. While the equity index futures may be quiet, opportunities could be developing in Treasury bonds, gold, crude oil, grains, currencies, or even Bitcoin futures.

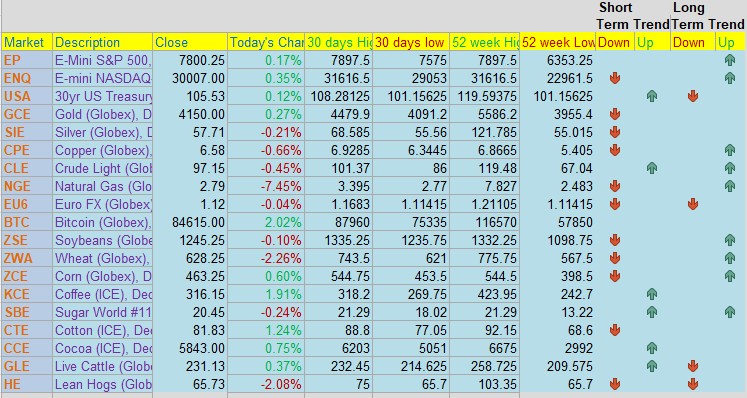
Looking at today’s market landscape, we’re seeing mixed performance across asset classes. Bitcoin futures are showing strong momentum, coffee continues to trend higher, while natural gas and wheat have experienced increased downside volatility. At the same time, key stock index futures such as the E-mini S&P 500 and Nasdaq continue to trade near their recent highs, making it critical to understand where volatility is expanding and where it is contracting.

Support & Resistance for Traders

The support and resistance levels shown in our daily market sheets can help traders quickly identify potential breakout areas, reversal zones, and risk management points across multiple markets. Whether you’re primarily a stock index trader or focus on commodities, having several markets on your radar can help uncover opportunities when your favorite market is stuck in a narrow range.

Remember: volatility creates opportunity (and risk!), but only if you’re watching where it’s moving.

The traders who consistently adapt to changing market conditions are often the ones who cast a wider net and remain flexible enough to follow the action wherever it appears.

December Corn

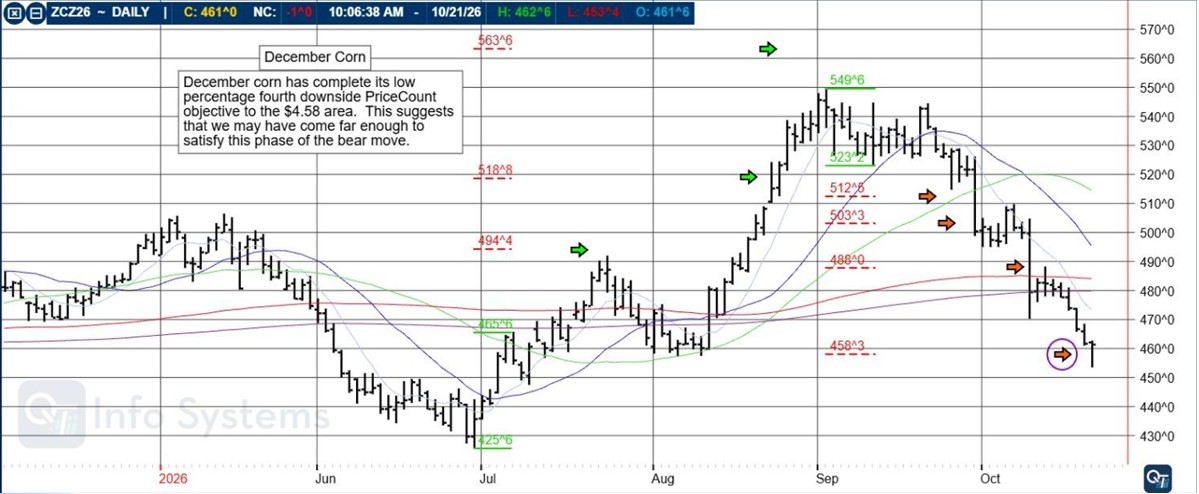
December Corn has completed its low percentage fourth downside PriceCount objective to the $4.58 area. This suggests that we may have come far enough to satisfy this phase of the bear move.

cf4b3d51 d974 4d2c a454 96e6e898bb40

The PriceCount study is a tool that can help to project the distance of a move in price. The counts are not intended to be an ‘exact’ science but rather offer a target area for the four objectives which are based off the first leg of a move with each subsequent count having a smaller percentage of being achieved.

It is normal for the chart to react by correcting or consolidating at an objective and then either resuming its move or reversing trend. Best utilized in conjunction with other technical tools, PriceCounts offer one more way to analyze charts and help to manage your positions and risk.

Learn more at https://www.qtinfo.com/analysis/qt-chart-of-the-day/

Trading in futures, options, securities, derivatives or OTC products entails significant risks which must be understood prior to trading and may not be appropriate for all investors. Past performance of actual trades or strategies is not necessarily indicative of future results.

Cannon Edge — Your Daily Futures Snapshot for Oct. 22nd

71c6b964 2a57 4b3f a1b6 b82831cd98cf

Cannon Edge is our new daily feature designed to give traders a fast, actionable overview of key futures markets. Each post delivers:\

·    Current price and daily % change

·    30‑day and 52‑week highs/lows

·    PROPRIETARY Short‑term and long‑term trend signals

·    Coverage across equity indices, metals, energies, currencies, and ags

Whether you’re scanning for breakout setups, trend reversals, or just staying informed — Cannon Edge puts the data in your hands before the open.

Built for speed. Backed by insight. Powered by CQG.

Daily Levels for October 22nd, 2026

65f0a761 9f3a 4086 9016 052ebf668f1f

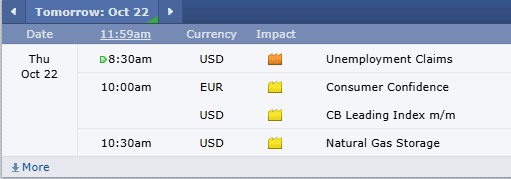
Economic Reports

provided by: ForexFactory.com

All times are Central Time ( Chicago)

5ee2c8fc 7c28 45ea 9036 39e57956bc5f

Find us on Trustpilot

41a3c910 28d6 4126 946b 6659bb02ae4d

Trading Futures, Options on Futures, and retail off-exchange foreign currency transactions involves substantial risk of loss and is not suitable for all investors. You should carefully consider whether trading is suitable for you in light of your circumstances, knowledge, and financial resources. You may lose all or more of your initial investment. Opinions, market data, and recommendations are subject to change at any time.

Join our Private Facebook group

Subscribe to our YouTube Channel

Listen to our podcast: Subscribe on Apple, Spotify, Amazon

or wherever you listen to podcasts!

S
Facebook  Instagram  LinkedIn
S
ef3ab1c9 8d6d 4e60 a3f1 af5d9d4ecbb3

Services

Software

Tools

Community

Contact

By Cannon Operations « Back to All Posts