Daily Support & Resistance Levels

This blog provides daily support and resistance levels for major commodities, indices, and financial futures contracts, along with market outlooks and insights.

August 10, 2026
Crude Oil

Crude Oil Pricing amidst the Ongoing Conflict; Your Important Futures Trading Guide for August 11th, 2026

crude oil

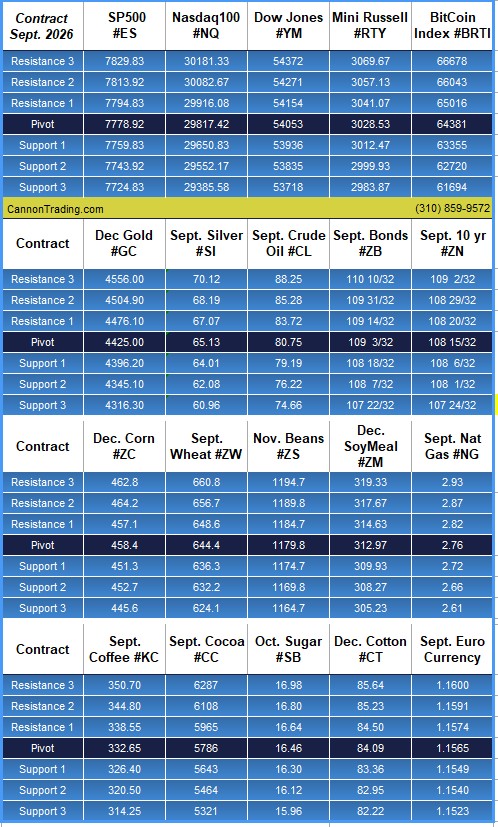
At A Glance Levels

Instrument S2 S1 Pivot R1 R2

Gold (GC)

— Dec. (#GC)

4345.10 4396.20 4425.00 4476.10 4504.90

Silver (SI)

— Sept. (#SI)

62.08 64.01 65.13 67.07 68.19

Crude Oil (CL)

— Sept. (#CL)

76.22 79.19 80.75 83.72 85.28

 Sept. Bonds (ZB)

— Sept. (#ZB)

108 7/32 108 18/32 109 3/32 109 14/32 110 31/32

Priced Before Proven: A Range Resolved, a Ceasefire Assumed, and a Labor Market Going Quiet

By Eli Gal Levy, Senior Analyst

US/Iran Conflict – Deal?

The week’s story is easy to state and harder to sit with: the market got paid for believing things that have not happened yet. Stocks rallied to fresh all-time highs — every major index except the Nasdaq — and the move was set off at the very start of the week by a simultaneous drop in oil prices and Treasury yields after the Treasury Secretary suggested a ceasefire with Iran was close. By Friday there was still no deal.

Oman/Crude Oil

The only agreement visibly in the works appears to be one with Oman, and a report late in the week described Iran’s draft plan as banning the United States and Israel from the Strait entirely — the opposite of the “freedom of movement” language that started the rally on Monday. Crude and the curve are trading as if the probability of a resolution is high. That’s a position, not a fact.

S&P

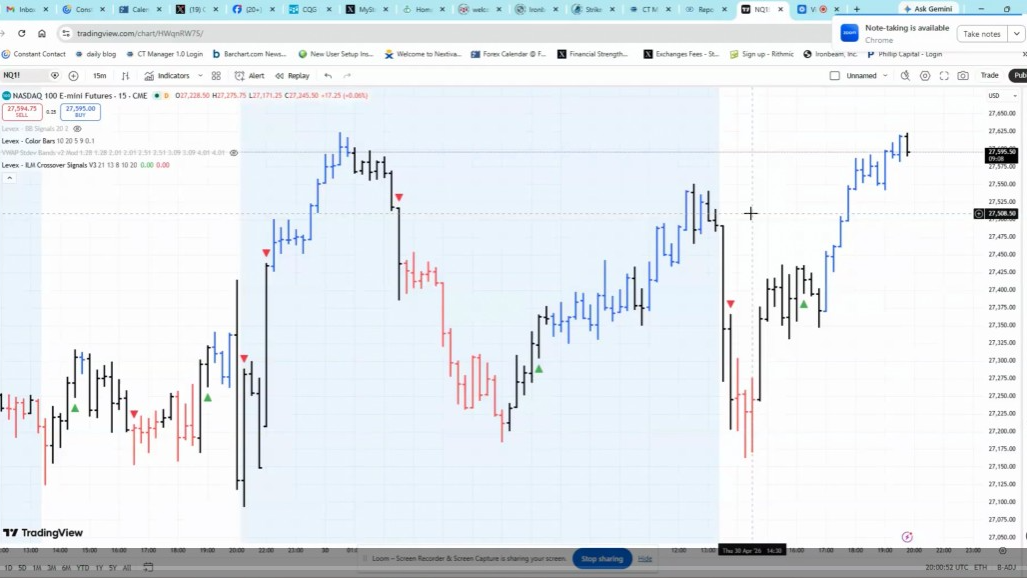
The cleanest thing that happened was technical. After roughly three months of chopping inside a 7,250–7,600 band, the S&P broke out to fresh all-time highs on Wednesday. A three-month range resolving upward is an incrementally bullish development on its own terms, and it tends to bring a second wave of buying that has nothing to do with fundamentals: performance chasing by managers who are behind the index, and short covering by anyone who spent the summer positioned for the range to hold.

Call volume in the S&P complex stayed elevated all week, which is what it looks like when the fear of missing a move overtakes the fear of the move. The counterweight is just as mechanical — a market that gains this much this fast is stretched near-term, and a breakout that needs chasing to sustain itself is the one most exposed if the catalyst behind it never arrives. FINISH READING and VIEW CHARTS

Need help looking at different markets? get some insight from an experienced series 3 broker?

The call is free and we are here to assist – try us!

+310 859 9572

September Silver

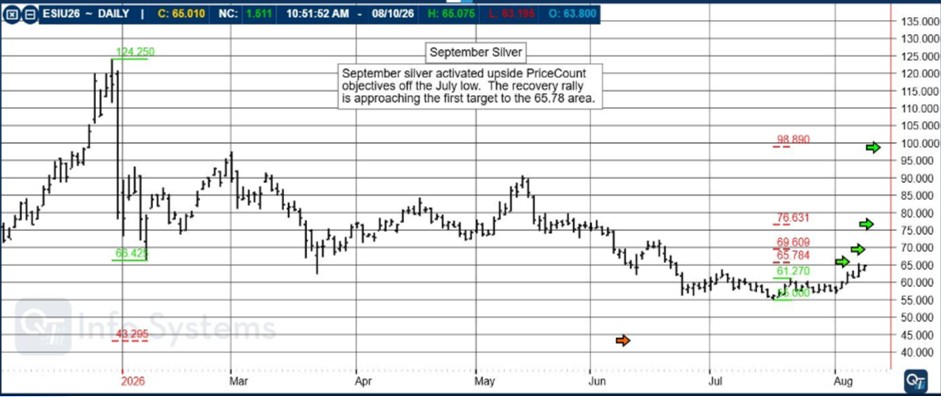
September Silver activated upside PriceCount objectives off the July low. The recovery rally is approaching the first target to the 65.78 area.

80c9e419 6052 4fc8 8591 316cf0af1668

The PriceCount study is a tool that can help to project the distance of a move in price. The counts are not intended to be an ‘exact’ science but rather offer a target area for the four objectives which are based off the first leg of a move with each subsequent count having a smaller percentage of being achieved.

It is normal for the chart to react by correcting or consolidating at an objective and then either resuming its move or reversing trend. Best utilized in conjunction with other technical tools, PriceCounts offer one more way to analyze charts and help to manage your positions and risk.

Learn more at www.qtchartoftheday.com

Trading in futures, options, securities, derivatives or OTC products entails significant risks which must be understood prior to trading and may not be appropriate for all investors. Past performance of actual trades or strategies is not necessarily indicative of future results.

FREE TRIAL TO QT MARKET Center – Access to analysis, tools, news & Much more!

Highly recommended for HEDGERS!

Trading Signals on Trading View – FREE Trial

undefined

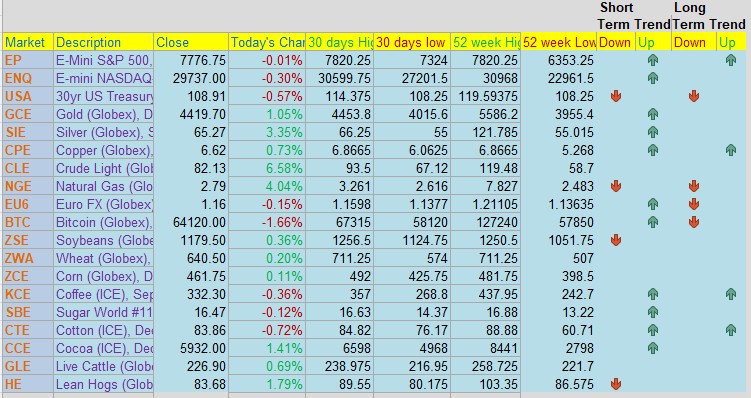
Cannon Edge — Your Daily Futures Snapshot for August 11th

81d0f609 a5d7 45ef bd27 5e77d535e248

Cannon Edge is our new daily feature designed to give traders a fast, actionable overview of key futures markets. Each post delivers:

·    Current price and daily % change

·    30‑day and 52‑week highs/lows

·    PROPRIETARY Short‑term and long‑term trend signals

·    Coverage across equity indices, metals, energies, currencies, and ags

Whether you’re scanning for breakout setups, trend reversals, or just staying informed — Cannon Edge puts the data in your hands before the open.

 Built for speed. Backed by insight. Powered by CQG.

Daily Levels for August 11th, 2026

e8ebd877 5916 4955 9899 3bc88b084fb8

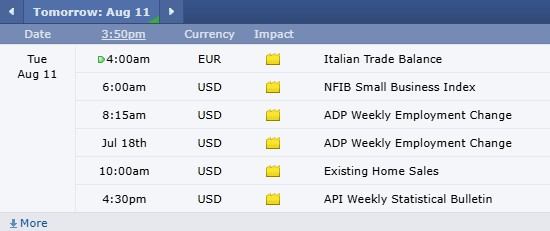
Economic Reports

provided by: ForexFactory.com

All times are Central Time ( Chicago)

8bb3cfde 6610 49d9 b7af 97266c9884eb

Find us on Trustpilot

41a3c910 28d6 4126 946b 6659bb02ae4d

Trading Futures, Options on Futures, and retail off-exchange foreign currency transactions involves substantial risk of loss and is not suitable for all investors. You should carefully consider whether trading is suitable for you in light of your circumstances, knowledge, and financial resources. You may lose all or more of your initial investment. Opinions, market data, and recommendations are subject to change at any time.

Join our Private Facebook group

Subscribe to our YouTube Channel

Listen to our podcast: Subscribe on AppleSpotify, Amazon

or wherever you listen to podcasts!

S
Facebook  Instagram  LinkedIn
S
ef3ab1c9 8d6d 4e60 a3f1 af5d9d4ecbb3
Services
Software
Tools
Community
Contact
By Cannon Operations « Back to All Posts