The Capex Question: When Strong Quarters Aren’t Enough
Energy Futures
By Eli Levy, Senior Analyst & Series 3 Broker

Energy – WTI Crude/US-Iran Negotiations
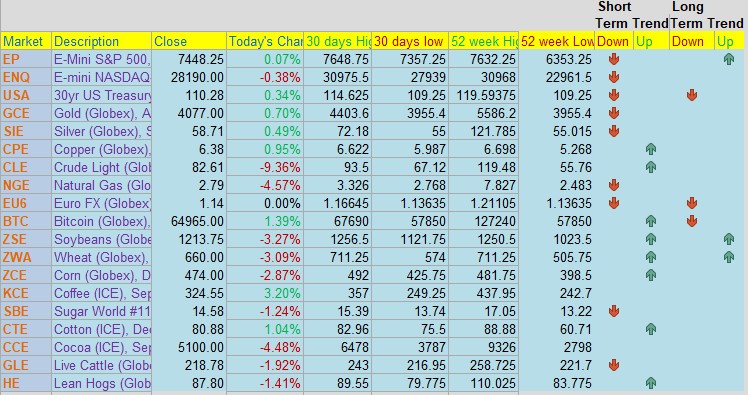
This week the market didn’t fall so much as it changed leaders. Energy did the roaring — WTI crude jumped 14% last week and is on track for another 8% this week. Friday pullback appears tied to reports that Pakistan is exploring a path toward resuming the stalled U.S.–Iran negotiations. Meanwhile, the air came out of the part of the market everyone was most comfortable owning: big-cap tech. Underneath a fairly calm index, the leadership is quietly rotating out of one corner and into another, and that churn is the real story of the week.
Tech – Google
The crack in tech has a name and a number. The relative weakness was driven mostly by a post-earnings sell-off in Alphabet (GOOGL) on Wednesday after the bell. The quarter itself was strong — cloud revenue up 82% year-over-year against whisper numbers around +70–75% — but the spending told a different story.
Alphabet raised 2026 capex guidance from $180–190B to $195–205B and said 2027 would climb “significantly” from there, and the company posted negative free cash flow (-$5.9B) for the first time since it went public in August 2004.
Demand for compute is clearly still enormous; what soured sentiment was the bill for chasing. Investors are increasingly asking what the return on all this hyperscaler spending actually is — and for now they’re voting with their feet.
Stock Indices – S&P 500
That’s one side of the story. The other side is genuinely strong, and it starts with earnings. Through 133 S&P 500 reports, 70% have beaten on the top line and 87% on the bottom line, with EPS growth tracking at 69.81% and revenue growth at 12.61% — and the commentary from the financial giants about the consumer has been encouraging.
This is the ground the bulls stand on. Ed Yardeni of Yardeni Research is holding his Street-high 8,250 S&P target, calling the advance earnings-driven rather than an AI bubble, even as he allows for a possible “summer stall” along the way. Andrew Fry of Crescent Grove reads the tape as constructive over the medium term precisely because of the rotation — equal-weight outperforming cap-weight as money leaves crowded megacap tech for financials, health care, and even developed Europe and Japan (via the EFA), segments he frames as quieter beneficiaries of AI diffusing through the economy rather than the ones footing the capex bill.
In their telling, leadership changing hands is what a healthy, broadening market looks like.
CRASH – Semiconductors
The cautious camp is looking at the same tape and seeing a de-risking that isn’t finished. Jeff DeGraff of Renaissance Macro Research calls this a momentum-crash environment — the momentum factor has gone from roughly the 100th percentile over the last thirty-odd years down to the mid-30s in just two weeks, and history says these unwinds usually run their course completely before they’re done.
Final Thoughts
His read: the semiconductors and hardware names got deeply oversold (84% of semi and equipment names hit 20-day lows earlier in the week), so a bounce is likely — but a bounce that may fail to make a new high and only retraces about half the drawdown. He’d rather sell the good charts into strength and buy the ones just emerging — Apple (AAPL), banks, insurers, REITs, health care — pointing to Nvidia (NVDA) as the cautionary case of a former momentum darling that’s spent two years digesting its own good news.
Jonathan Krinsky of BTIG stays outright bearish on chips, arguing the group could keep sliding to test its 200-day moving averages and that it’s still “premature to look for a bottom.” Katie Stockton of Fairlead Strategies flags the Nasdaq’s break below recent support as a reason to brace for near-term volatility.
|