Cannon Futures Weekly Newsletter Issue # 1046
Dear Traders,
Get Real Time updates and more on our private FB group!
Trading 102: Commitment of Traders Report – What Lies beneath
Commitment of Traders Report – COT
Commitment of Traders Report offers wealth of data when it comes to commodity and futures trading. You can somewhat say, this is a window into what the “big boys are doing” which is published weekly.
In this 24 page PDF booklet, Gary Kamen of Trends in Futures reviews the commitment of traders report, what it means, how traders can utilize it and much more.
Sign up and instantly download the booklet and learn about:
* History of the COT report
* Why is this report important?
* The new COT report
* How can you use the information in this report?
* And much more….
Next targets? Levels of support? will this past week slow price action continue or will the “speedy price action ” of weeks before return?
M S&P’s ( June mini SP 500)
4,101 OBJECTIVE has been met.
Market could have a retracement back
to 4075.00.
Next test area is 4145.00
No two Bull or Bear markets are alike. This pandemic is similar to 1918 (post WW1), which originated in China, unfortunately killing 50 million globally. The pent up demand led to the Roaring 20’s, which is the cycle we’re presently in. With the FED all in with unprecedented stimulus, we could see a 8-9% GDP number!
Q.E. is $120 billion a month, coupled
with the 3 stimulus packages and the new $2.2 trillion infrastructure in the pipeline. Also, the FED is allowing inflation to run hot, above their 2% target, using a weak US$, as its main catalyst. Lastly, the SHORT END may remain untouched for 2 years.
Eventually, the FED will lose control of the LONG END of the curve!
Future CAVEAT, is that we all know how the Roaring 20’s ended on Oct. 29, 1929.

Trading Futures, Options on Futures, and retail off-exchange foreign currency transactions involves substantial risk of loss and is not suitable for all investors. You should carefully consider whether trading is suitable for you in light of your circumstances, knowledge, and financial resources. You may lose all or more of your initial investment. Opinions, market data, and recommendations are subject to change at any time when it comes to Futures Trading.
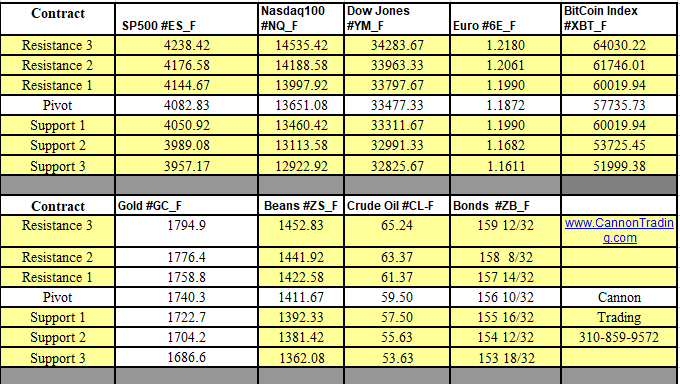
Futures Trading Levels
4-12-2021
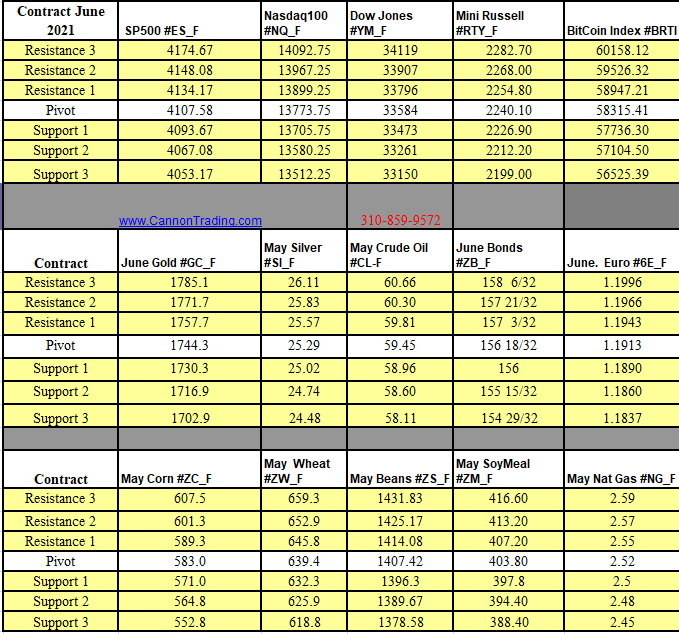
Weekly Levels
Reports, First Notice (FN), Last trading (LT) Days for the Week:
https://mrci.com
Date Reports/Expiration Notice Dates

This is not a solicitation of any order to buy or sell, but a current market view provided by Cannon Trading Inc. Any statement of facts herein contained are derived from sources believed to be reliable but are not guaranteed as to accuracy, nor they purport to be complete. No responsibility is assumed with respect to any such statement or with respect to any expression of opinion herein contained. Readers are urged to exercise their own judgment in trading


