
The Week Ahead by John Thorpe, Senior Broker
Economic Data :
- Mon. Chi Fed Natl Activity index,
- Tues. Redbook, Existing Home Sales
- Wed. Bldg Permits, Trade Balance, Retail/Wholesale Inventories , PMI, New Home Sales.
- Thu. Durable Goods, GDP and Jobless Claims
- Fri. Core PCE, Mich. Consumer Sentiment
Earnings Reports:
- Tues. A.M. UPS – P.M. Google, Tesla, Visa, Texas Instruments
- Wed. A.M. CME – P.M. IBM, Qualcom
Fed Speakers:
- Just one this week that we know of, Wed, Bowman @3:05 P.M. Central


Hot Market Report – October Lean Hogs
Hot market of the week is provided by QT Market Center, A Swiss army knife charting package that’s not just for Hedgers, Cooperatives and Farmers alike but also for Spread traders, Swing traders and shorter time frame application for intraday traders with a unique proprietary indicator that can be applied to your specific trading needs.
October Lean Hogs
October lean hogs finally stabilized their extended slide and activated upside PriceCount objectives on the correction higher. The recovery rally has accelerated and is approaching the second upside PriceCount objective to the 75.62 area.
PriceCounts – Not about where we’ve been , but where we might be going next!

The PriceCount study is a tool that can help to project the distance of a move in price. The counts are not intended to be an ‘exact’ science but rather offer a target area for the four objectives which are based off the first leg of a move with each subsequent count having a smaller percentage of being achieved. It is normal for the chart to react by correcting or consolidating at an objective and then either resuming its move or reversing trend. Best utilized in conjunction with other technical tools, PriceCounts offer one more way to analyze charts and help to manage your positions and risk. Learn more at www.qtchartoftheday.com
Trading in futures, options, securities, derivatives or OTC products entails significant risks which must be understood prior to trading and may not be appropriate for all investors. Past performance of actual trades or strategies is not necessarily indicative of future results. The PriceCount study is a tool that can help to project the distance of a move in price. The counts are not intended to be an ‘exact’ science but rather offer a target area for the four objectives which are based off the first leg of a move with each subsequent count having a smaller percentage of being achieved. It is normal for the chart to react by correcting or consolidating at an objective and then either resuming its move or reversing trend. Best utilized in conjunction with other technical tools, PriceCounts offer one more way to analyze charts and help to manage your positions and risk. Learn more at www.qtchartoftheday.com
Trading in futures, options, securities, derivatives or OTC products entails significant risks which must be understood prior to trading and may not be appropriate for all investors. Past performance of actual trades or strategies is not necessarily indicative of future results.

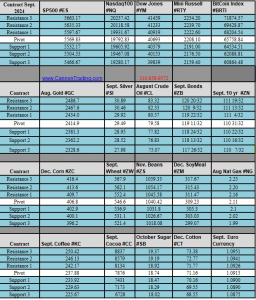
Daily Levels for July 22nd, 2024

Improve Your Trading Skills
Get access to proprietary indicators and trading methods, consult with an experienced broker at 1-800-454-9572.
Explore trading methods. Register Here

* This is not a solicitation of any order to buy or sell, but a current market view provided by Cannon Trading Inc. Any statement of facts here in contained are derived from sources believed to be reliable, but are not guaranteed as to accuracy, nor they purport to be complete. No responsibility is assumed with respect to any such statement or with respect to any expression of opinion herein contained. Readers are urged to exercise their own judgement in trading.