Charts & Indicators Archives - Support & Resistance Levels

Charts & Indicators

Category Archives: Charts & Indicators


Stock Index Futures Fall Sharply Again Amid High Volatility

July 25th, 2024 Filed under Charts & Indicators, Commodity Brokers, Commodity Trading, Day Trading, E-Mini Futures, Future Trading News, Futures Broker, Futures Trading, Index Futures, Indices, Nasdaq, S&P 500 | Comment (0)

Get Real Time updates and more by joining our Private Facebook Group!
Subscribe to our YouTube Channel
Listen to our Market Recap Podcasts on Apple Podcasts


Stock Index Futures Fall Sharply -Again!


Stocks tried recovering after yesterday’s sell off and for a bit it seemed like they were but completely reversed and posted a bearish close!


Both silver and gold sold off sharply as well!


Crude oil managed to hold first level of support.


Side note if you are a day-trader in stock indices:


Volatility is quite high. This requires one to evaluate their stops? targets? Trading size?


With the micros Trading such good volume across the board a trader now has the option of trading one 3, 6 micros for example rather than trading one Single mini SP or mini Nasdaq This is especially true on volatility as as high as we see today And may help certain traders adapt to the volatility.


If you like feedback, discuss ideas – let us know and we will do our best to assist.


NQ daily chart for your review below with possible support levels.


textalertsbanner image

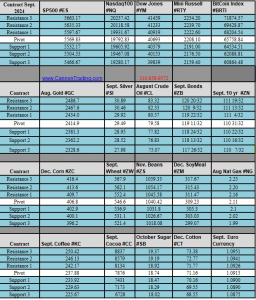
Daily Levels for July 26th, 2024

Economic Reports
provided by: ForexFactory.com
All times are Eastern Time ( New York)

Improve Your Trading Skills

Get access to proprietary indicators and trading methods, consult with an experienced broker at 1-800-454-9572.

Explore trading methods. Register Here

* This is not a solicitation of any order to buy or sell, but a current market view provided by Cannon Trading Inc. Any statement of facts here in contained are derived from sources believed to be reliable, but are not guaranteed as to accuracy, nor they purport to be complete. No responsibility is assumed with respect to any such statement or with respect to any expression of opinion herein contained. Readers are urged to exercise their own judgement in trading.


Movers & Shakers: Market Insights and Key Developments

July 23rd, 2024 Filed under Charts & Indicators, Commodity Brokers, Commodity Trading, Day Trading, Future Trading News, Futures Broker, Futures Trading, Trading Guide | Comment (0)

Get Real Time updates and more by joining our Private Facebook Group!
Subscribe to our YouTube Channel
Listen to our Market Recap Podcasts on Apple Podcasts


Movers & Shakers

By John Thorpe, Senior Broker


Todays Headlines


**US June NAR Existing Homes Sales: -5.4%; expected -4.0%

**US June NAR Existing Homes Sales: 3.89 mln unit annualized rate; expected 3.95 mln

**US June NAR Existing Homes Median Home Price: $426,900 ; +4.1% vs yr ago month

**US June NAR Existing Homes Inventory of Unsold Homes: 4.1 Months


**Richmond Fed July Manufacturing New Orders: -23.0 ; prior -17.0


Updated: July 23, 2024 10:19 am

President Biden’s administration senior climate policy advisor, Podesta, said they will seek to curb nitrous oxide emissions . The administration claims nitrous oxide and methane cause the other half of climate change. Nitrous oxide emissions come from a variety of sources including some fertilizers and synthetic materials production. It’s unclear what the costs will be to cut the emissions.

Russia’s Deputy PM Novak Tuesday said the Kremlin will restart gasoline export ban starting August 1st, and then consider extensions in September and October


Traders Tuesday afternoon estimated commodity funds added a net 7,500 Chicago corn futures, but shed a net 1,500 Chicago wheat. Traders estimate funds bought a net 5,500 Soybean, 2,000 soymeal and 1,500 soyoil contracts on Tuesday.


Tomorrows Movers and Shakers

S&P Global group will release their US prelim July manufacturing and service sector purchasing managers indexes (PMI) at 8:45 am CT Wednesday morning. Analysts expect the manufacturing index at 51.5 compared to the 51.6 in the final June report. The service index for early July is expected at 55.0 compared to the 55.3 in the final June report.


US new home sales data for June will be updated Wednesday morning at 9:00 am CT. Analysts expect new home sales month-to-month at a 0.640 mln unit annualized pace, up +3.4%. The prior month’s sales were -11.3% at 0.619 mln unit annual rate.

EIA Weekly Petroleum Stocks Estimates for Wednesday, July 24 at 9:30 AM CT

in million barrels per day (mln bpd)

IBM reports after the close


textalertsbanner image

Daily Levels for July 24th, 2024

Economic Reports
provided by: ForexFactory.com
All times are Eastern Time ( New York)

Improve Your Trading Skills

Get access to proprietary indicators and trading methods, consult with an experienced broker at 1-800-454-9572.

Explore trading methods. Register Here

* This is not a solicitation of any order to buy or sell, but a current market view provided by Cannon Trading Inc. Any statement of facts here in contained are derived from sources believed to be reliable, but are not guaranteed as to accuracy, nor they purport to be complete. No responsibility is assumed with respect to any such statement or with respect to any expression of opinion herein contained. Readers are urged to exercise their own judgement in trading.


What you need to know for trading the week ahead + Levels for July 22nd

July 19th, 2024 Filed under Charts & Indicators, Commodity Brokers, Commodity Trading, Day Trading, Economic Trading, Future Trading News, Futures Broker, Futures Trading, Trading Guide, Weekly Newsletter | Comment (0)

Get Real Time updates and more by joining our Private Facebook Group!
Subscribe to our YouTube Channel
Listen to our Market Recap Podcasts on Apple Podcasts


The Week Ahead by John Thorpe, Senior Broker

Economic Data :

  • Mon. Chi Fed Natl Activity index,
  • Tues. Redbook, Existing Home Sales
  • Wed. Bldg Permits, Trade Balance, Retail/Wholesale Inventories , PMI, New Home Sales.
  • Thu. Durable Goods, GDP and Jobless Claims
  • Fri. Core PCE, Mich. Consumer Sentiment

Earnings Reports:

  • Tues. A.M. UPS – P.M. Google, Tesla, Visa, Texas Instruments
  • Wed. A.M. CME – P.M. IBM, Qualcom

Fed Speakers:

  • Just one this week that we know of, Wed, Bowman @3:05 P.M. Central


Hot Market Report – October Lean Hogs

Hot market of the week is provided by QT Market Center, A Swiss army knife charting package that’s not just for Hedgers, Cooperatives and Farmers alike but also for Spread traders, Swing traders and shorter time frame application for intraday traders with a unique proprietary indicator that can be applied to your specific trading needs.


FREE TRIAL AVAILABLE


October Lean Hogs


October lean hogs finally stabilized their extended slide and activated upside PriceCount objectives on the correction higher. The recovery rally has accelerated and is approaching the second upside PriceCount objective to the 75.62 area.

PriceCounts – Not about where we’ve been , but where we might be going next!

The PriceCount study is a tool that can help to project the distance of a move in price. The counts are not intended to be an ‘exact’ science but rather offer a target area for the four objectives which are based off the first leg of a move with each subsequent count having a smaller percentage of being achieved. It is normal for the chart to react by correcting or consolidating at an objective and then either resuming its move or reversing trend. Best utilized in conjunction with other technical tools, PriceCounts offer one more way to analyze charts and help to manage your positions and risk. Learn more at www.qtchartoftheday.com


Trading in futures, options, securities, derivatives or OTC products entails significant risks which must be understood prior to trading and may not be appropriate for all investors. Past performance of actual trades or strategies is not necessarily indicative of future results. The PriceCount study is a tool that can help to project the distance of a move in price. The counts are not intended to be an ‘exact’ science but rather offer a target area for the four objectives which are based off the first leg of a move with each subsequent count having a smaller percentage of being achieved. It is normal for the chart to react by correcting or consolidating at an objective and then either resuming its move or reversing trend. Best utilized in conjunction with other technical tools, PriceCounts offer one more way to analyze charts and help to manage your positions and risk. Learn more at www.qtchartoftheday.com


Trading in futures, options, securities, derivatives or OTC products entails significant risks which must be understood prior to trading and may not be appropriate for all investors. Past performance of actual trades or strategies is not necessarily indicative of future results.

textalertsbanner image

Daily Levels for July 22nd, 2024


Economic Reports
provided by: ForexFactory.com
All times are Eastern Time ( New York)

Improve Your Trading Skills

Get access to proprietary indicators and trading methods, consult with an experienced broker at 1-800-454-9572.

Explore trading methods. Register Here

* This is not a solicitation of any order to buy or sell, but a current market view provided by Cannon Trading Inc. Any statement of facts here in contained are derived from sources believed to be reliable, but are not guaranteed as to accuracy, nor they purport to be complete. No responsibility is assumed with respect to any such statement or with respect to any expression of opinion herein contained. Readers are urged to exercise their own judgement in trading.


New TradingView Features and Copper Futures Chart Review

July 18th, 2024 Filed under Charts & Indicators, Commodity Brokers, Commodity Trading, Day Trading, Future Trading News, Futures Broker, Futures Trading, Metal Futures | Comment (0)

Get Real Time updates and more by joining our Private Facebook Group!
Subscribe to our YouTube Channel
Listen to our Market Recap Podcasts on Apple Podcasts


Light reports day tomorrow after a very volatile week, which for the most part saw significant rotation from the high tech sector into the Dow 30 sector.

If you are a TradingView users, we have good news for you!

Lower day trading margins, mobile TradingView App and more!

Contact your Cannon Trading broker if you are a client and feel free to reach out with any questions if you are a client or a prospect and a series 3 team member will gladly answer your questions.

Today’s most noticeable mover was copper futures, down 3.3% after a sell signal yesterday was confirmed by a price break lower.

Daily chart for your review below.


textalertsbanner image

Daily Levels for July 19th, 2024


Economic Reports
provided by: ForexFactory.com
All times are Eastern Time ( New York)

Improve Your Trading Skills

Get access to proprietary indicators and trading methods, consult with an experienced broker at 1-800-454-9572.

Explore trading methods. Register Here

* This is not a solicitation of any order to buy or sell, but a current market view provided by Cannon Trading Inc. Any statement of facts here in contained are derived from sources believed to be reliable, but are not guaranteed as to accuracy, nor they purport to be complete. No responsibility is assumed with respect to any such statement or with respect to any expression of opinion herein contained. Readers are urged to exercise their own judgement in trading.


Today’s Headlines and Tomorrow’s Market Movers: IMF Growth Forecast, Fed Updates, and Key Economic Data

July 16th, 2024 Filed under Charts & Indicators, Commodity Brokers, Commodity Trading, Day Trading, Economic Trading, Future Trading News, Futures Broker, Futures Trading, Trading Guide | Comment (0)

Get Real Time updates and more by joining our Private Facebook Group!
Subscribe to our YouTube Channel
Listen to our Market Recap Podcasts on Apple Podcasts


Movers & Shakers

By John Thorpe, Senior Broker


Today’s Headlines recap:

  • The Int’l Monetary Fund (IMF) raised their 2024 China growth forecast to +5.0% from the previous +4.6% estimate
  • CDC officials Tuesday said there are still no signs of human to human transmission of bird flu, risk of infection still remains very low for the general population
  • The Int’l Monetary Fund (IMF) claimed tariff increases could push inflation upward.
  • Fed Gov Kugler: inflation upside risks and labor market down side risks have become more balanced, but would be appropriate to lower rates sooner rather than later if labor market cools too much. If economic conditions continue to evolve favorably, then it will be appropriate to begin easing later this year


Tomorrow’s Market movers:


  • US housing starts and building permit data will be released Wednesday morning at 7:30 am CT. Economists are forecasting housing starts +1.8% month-to-month to 1.30 mln unit annualized pace in June. They are also forecasting US building permit data +1.0% to 1.40 mln unit rate.
  • Richmond Fed President Barkin will speak at a Greater Prince George’s Business Roundtable event Wednesday, starting around 8:00 am CT.
  • The Federal Reserve will release their monthly industrial production and capacity utilization data Wednesday morning around 8:15 am CT. Analysts expect June production +0.3% on month-to-month terms, and expect capacity use at 78.5% compared to the previous month’s 78.7%.
  •  Kansas City Fed event will start Wednesday with Federal Reserve Governor Waller and Kansas City Fed President Schmid set to give opening remarks around 8:35 am CT.
  • US Treasury announced it will auction $60 bln in 17 wk TBills on Wednesday
  • Federal Reserve “Beige Book” of anecdotal economic conditions from US Federal Reserve districts will be released Wednesday afternoon around 1:00 pm CT.


Daily Levels for July 17th, 2024

Economic Reports
provided by: ForexFactory.com
All times are Eastern Time ( New York)

Improve Your Trading Skills

Get access to proprietary indicators and trading methods, consult with an experienced broker at 1-800-454-9572.

Explore trading methods. Register Here

* This is not a solicitation of any order to buy or sell, but a current market view provided by Cannon Trading Inc. Any statement of facts here in contained are derived from sources believed to be reliable, but are not guaranteed as to accuracy, nor they purport to be complete. No responsibility is assumed with respect to any such statement or with respect to any expression of opinion herein contained. Readers are urged to exercise their own judgement in trading.

Have A Questions? Open an account Free Demo Account Free Demo Account

Question?

Valid first name is required.
Valid last name is required.
Phone number is required.
E-mail is required.
Message is required.
Phone (USA)
Phone (International)
Our Approach

You and your broker will work together to achieve your trading goals. We develop long term relationships with our clients so that we can grow and improve together.
Learn More About Choosing Cannon

Our Platforms

Please click on one of our platforms below to learn more about them, start a free demo, or open an account.
E-Futures Sierra Charts Firetip (Mac Compatible) RTrader

Trading Tips You Can Use Right Away!


Watch 4 short videos on the topics of:
  • Using Bollinger Bands and Parabolics
  • Using range Bars for Day-Trading
  • The concept of Price Confirmation
  • How to Use Support & Resistance Levels
  • License 3 Broker at your Fingertips
________
Doing Business With
See more...
Loading
Loading

Loading