Financials Futures; 30 Yr Bond Note

Financials Futures; 30 Yr Bond Note


3 Main Types of Trading Days, 30 Year Bond Chart Review & Support and Resistance Levels 11.12.2021

November 11th, 2021 Filed under Charts & Indicators, Financial Futures, Future Trading News | Comment (0)

Dear Futures Trader,

Get Real Time updates and more on our private FB group!
Yesterday we had a nice volatile day, with price action both up and down and then we followed it today ( Veteran’s Day, banks are closed) with very choppy, much narrower price action. Tomorrow is Friday, after a quiet day and with some meanigful reports – which encouraged me to share the following with you on the different types of trading days:

 In my opinion there are 3 main types of trading days:

1. The most common day are two sided trading action with swings up and down – this type of trading day is most suitable for using support and resistance levels along with overbought/oversold indicators.
2. Strong trending days, mostly one directional – this type of trading day is the least common, many times will happen on Mondays and maybe 3-5 times a month at most – this type of trading day is most suitable for using ADX, MACD crossovers and pretty much looking for pullbacks to jump on the trend perhaps with the help of parabolics.
3. Slow and/or choppy trading days – this type of trading day is best suited for taking small profits from the market by looking at volume spikes, using stochastics as possible entry signals and usually wait for a pullback before jumping in.
·A good question I’ve been asked is how can one asses what type of trading day we will have while the market is still trading….I have been doing some work in finding the answers and will be happy to hear feedback via email but here are some initial observations:
1.  Was the overnight session a wide, two sided trading range? If the answer is yes, good chances for similar trading day during the primary session (primary session is when the cash/stock market is open)
2. Mondays have the highest chance for trending days
3. The behavior of the first hour of trading can also suggests the type of action for the rest of the day.
4. If the first 30 minutes of the trading day have good volume, better chances for type 1 or type 2 trading days.
5. Low volume during the first 30 minutes can suggest a choppy (type 3 trading day)
6. Are there other strong trends in other sectors? ( bonds? metals? energies? Dollar index? )
Trading Futures, Options on Futures, and retail off-exchange foreign currency transactions involves substantial risk of loss and is not suitable for all investors. You should carefully consider whether trading is suitable for you in light of your circumstances, knowledge, and financial resources. You may lose all or more of your initial investment. Opinions, market data, and recommendations are subject to change at any time when it comes to Futures Trading.
Hourly/ 60 minutes chart click for larger image) of the 30 yr bonds (ZB or USA) for your review below. I have heard from some clients that they “like the personality of the bonds” better than the ES and NQ. Different dynamics, larger tick size – may be worth your time to follow and try in SIM MODE first
Futures US Treasury Bond 60 minute Chart
If you are looking for other reference material please contact your Cannon Broker for lists of solid, informative and helpful trading tomes

Good Trading

Trading Futures, Options on Futures, and retail off-exchange foreign currency transactions involves substantial risk of loss and is not suitable for all investors.  You should carefully consider whether trading is suitable for you in light of your circumstances, knowledge, and financial resources. You may lose all or more of your initial investment. Opinions, market data, and recommendations are subject to change at any time when it comes to Futures Trading.


Futures Trading Levels

11-12-2021


Futures Support and Resistance Levels 11.12.2021


Economic Reports, source: 

https://bettertrader.co/ 

BetterTrader Reports


This is not a solicitation of any order to buy or sell, but a current market view provided by Cannon Trading Inc. Any statement of facts here in contained are derived from sources believed to be reliable, but are not guaranteed as to accuracy, nor they purport to be complete. No responsibility is assumed with respect to any such statement or with respect to any expression of opinion herein contained. Readers are urged to exercise their own judgement in trading.


30 Year Treasury Notes (ZB) 120min Chart & Futures Levels 12.03.2020

December 2nd, 2020 Filed under Future Trading News, Futures Broker | Comment (0)

_________________________________________________

Voted #1 Blog and #1 Brokerage Services on TraderPlanet for 2016!!  

_________________________________________________

Dear Traders,

Like us on FaceBook!
Get Real Time updates and market alerts on Twitter!
Each market has a different personality, different behavior along with different times of the day when it is most active. If you are finding that the ES (mini SP) is not giving you enough risk/opportunities then start monitoring a couple of other markets and perhaps explore them in demo / simulated mode.
I think that there are more than a few markets that are suitable for day-trading. Below you will find some observations, tips along with what are unique about these markets, personality and most active trading hours (interest rates, mostly the ten year and 30 year).
In most platforms, the symbols are ZB for 30 year bonds and ZN for 10 year notes.
Product Symbol
ZB
Contract Size
The unit of trading shall be U.S. Treasury Bonds having a face value at maturity of one hundred thousand dollars ($100,000) or multiples thereof
Price Quotation
Points ($1,000) and 1/32 of a point. For example, 134-16 represents 134 16/32. Par is on the basis of 100 points.
Product Symbol
ZN
Underlying Unit
One U.S. Treasury note having a face value at maturity of $100,000.
Deliverable Grades
U.S. Treasury notes with a remaining term to maturity of at least six and a half years, but not more than 10 years, from the first day of the delivery month. The invoice price equals the futures settlement price times a conversion factor, plus accrued interest. The conversion factor is the price of the delivered note ($1 par value) to yield 6 percent.
Price Quote
Points ($1,000) and halves of 1/32 of a point. For example, 126-16 represents 126 16/32 and 126-165 represents 126 16.5/32. Par is on the basis of 100 points.
Tick Size
(minimum fluctuation)
One-half of one thirty-second (1/32) of one point ($15.625, rounded up to the nearest cent per contract), except for intermonth spreads, where the minimum price fluctuation shall be one-quarter of one thirty-second of one point ($7.8125 per contract).
Contract Months
The first five consecutive contracts in the March, June, September, and December quarterly cycle.
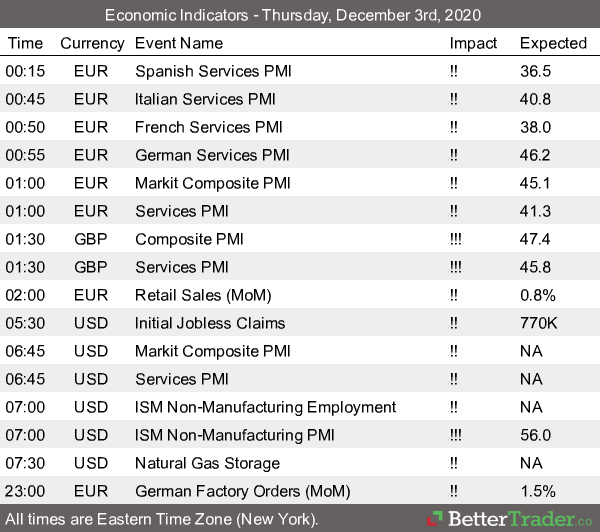
These contracts are often affected by many of the economic reports that come out at 8:30 AM Eastern and there is very active volume between the hours of 8 AM EST and 3 PM EST
Volume on both contracts is very good. Ten years will often have 1 million contracts traded per day (might be the second most active US futures market after the mini SP 500) and the bonds will avg. around 300,000 contracts.
These markets can experience very volatile movements during and right after different reports but then will often trade smooth or in an intraday trend the rest of the day.
Spread traders may find some interesting strategies trading the ZB/ZN spread or what I refer to as the 30/10 and some call NOB spread ( notes over bonds).
120 minute chart of the ZB or 30 yr bonds for observation below.

Good Trading

Trading Futures, Options on Futures, and retail off-exchange foreign currency transactions involves substantial risk of loss and is not suitable for all investors.  You should carefully consider whether trading is suitable for you in light of your circumstances, knowledge, and financial resources. You may lose all or more of your initial investment. Opinions, market data, and recommendations are subject to change at any time when it comes to Futures Trading.


Futures Trading Levels

12-03-2020

Economic Reports, source: 

 www.BetterTrader.co


This is not a solicitation of any order to buy or sell, but a current market view provided by Cannon Trading Inc. Any statement of facts here in contained are derived from sources believed to be reliable, but are not guaranteed as to accuracy, nor they purport to be complete. No responsibility is assumed with respect to any such statement or with respect to any expression of opinion herein contained. Readers are urged to exercise their own judgement in trading.

Have A Questions? Open an account Free Demo Account Free Demo Account

Question?

Valid first name is required.
Valid last name is required.
Phone number is required.
E-mail is required.
Message is required.
Phone (USA)
Phone (International)
Our Approach

You and your broker will work together to achieve your trading goals. We develop long term relationships with our clients so that we can grow and improve together.
Learn More About Choosing Cannon

Our Platforms

Please click on one of our platforms below to learn more about them, start a free demo, or open an account.
E-Futures Sierra Charts Firetip (Mac Compatible) RTrader

________
Doing Business With
See more...
Loading
Loading

Loading