Futures Trading Online

Futures Trading Online


Trading Levels & Reports for Quadruple Witching Friday June 15th 2012

June 14th, 2012 Filed under Future Trading News | Comments Off on Trading Levels & Reports for Quadruple Witching Friday June 15th 2012

Jump to a section in this post:

1. Market Commentary
2. Support and Resistance Levels – S&P, Nasdaq, Dow Jones, Russell 2000, Dollar Index
3. Support and Resistance Levels – Gold, Euro, Crude Oil, T-Bonds
4. Support and Resistance Levels – Corn, Wheat, Beans, Silver
5. Economic Reports for Friday June 15, 2012

Hello Traders,

Hello Traders,

Tomorrow ( Friday June 15th) is quadrupole witching day. Stock options, futures, futures options and single stock futures ALL expire.

Below is from a colleague of a colleague….

Expiration – comments ahead of this Fri from JPMorgan’s Marko Kolanovic – with key Greek elections coming this weekend, investors are closely looking for signs of stress in Europe and reviewing their tail hedging strategies.  $610bn of S&P 500 monthly options are expiring this Friday, making it the biggest S&P 500 options expiration year to date.  As these options don’t cover the election date, investors are rolling hedges into quarter-end, July and September expiry S&P 500 options. In addition, the open interest in VIX call options reached all time highs today (notional exposure of $430m per 1 VIX point).  Put-call gamma imbalance is still very high (~$12bn per 1%).  High level of put-call gamma imbalance means that investors hold option hedges and dealers are likely short these options and hence short S&P 500 gamma.  Short gamma exposure of dealers could fuel market volatility and increase the risk of a sharp selloff, should the macro fundamentals significantly worsen.

ALSO June currencies are about to enter delivery stage, which can be costly. I highly recommend starting to trade September currencies as of Friday morning .

Be disciplined, be patient and trade well!

Read the rest of this entry »


Trading Levels & Reports for June 14th – SP500 Trading in a Range

June 13th, 2012 Filed under Future Trading News | Comments Off on Trading Levels & Reports for June 14th – SP500 Trading in a Range

Jump to a section in this post:

1. Market Commentary
2. Support and Resistance Levels – S&P, Nasdaq, Dow Jones, Russell 2000, Dollar Index
3. Support and Resistance Levels – Gold, Euro, Crude Oil, T-Bonds
4. Support and Resistance Levels – Corn, Wheat, Beans, Silver
5. Economic Reports for Thursday June 14, 2012

Hello Traders,

First off heads up on some contract months changes:

1. Front month for stock indices, financials and many other markets is September.

2. June mini SP, mini NASDAQ, Russell, Dow etc. will expire Friday morning right before the open, so make sure you start trading September if you have not already done so!

3. June currencies are about to enter delivery stage, which can be costly. I highly recommend starting to trade September currencies as of Friday morning .

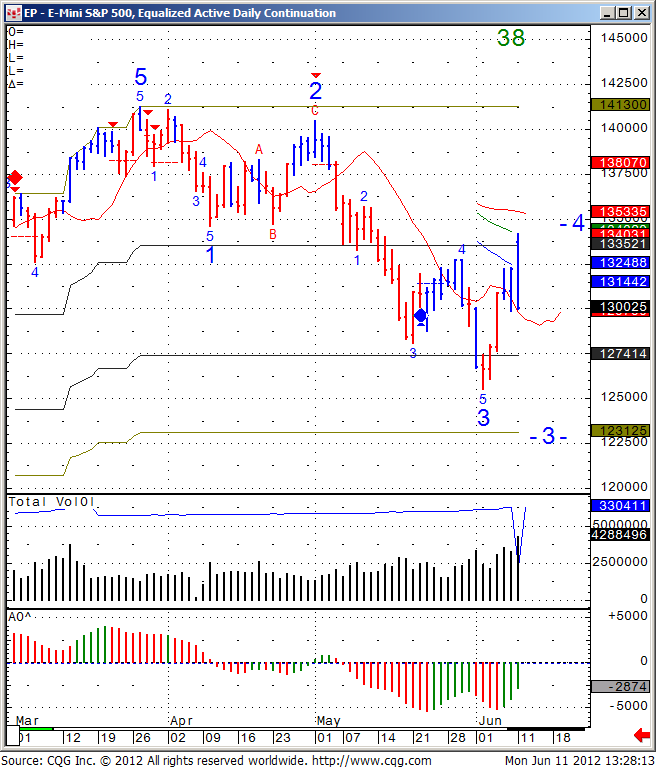
As far market direction, SP 500 still looks to be locked in between 1297 – 1342. My guess is that which ever way we going to break first will have chance for momentum continuation.

Be disciplined, be patient and trade well!

GOOD TRADING!

Trading Futures, Options on Futures, and retail off-exchange foreign currency transactions involves substantial risk of loss and is not suitable for all investors. You should carefully consider whether trading is suitable for you in light of your circumstances, knowledge, and financial resources. You may lose all or more of your initial investment. Opinions, market data, and recommendations are subject to change at any time.

2. Support and Resistance Levels – S&P, Nasdaq, Dow Jones, Russell 2000, Dollar Index

Contract Sept. 2012 SP500 (big & Mini) Nasdaq100 (big & Mini) Dow Jones (big & Mini) Mini Russell Dollar Index
Resistance 3 1335.27 2585.00 12633 775.97 83.17
Resistance 2 1327.98 2569.00 12577 768.93 82.88
Resistance 1 1318.37 2546.00 12498 758.97 82.50
Pivot 1311.08 2530.00 12442 751.93 82.21
Support 1 1301.47 2507.00 12363 741.97 81.83
Support 2 1294.18 2491.00 12307 734.93 81.54
Support 3 1284.57 2468.00 12228 724.97 81.16

3. Support & Resistance Levels for Gold, Euro, Crude Oil, and U.S. T-Bonds

Contract Aug Gold June Euro July Crude Oil Sept. Bonds
Resistance 3 1646.8 1.2772 85.54 151 20/32
Resistance 2 1636.4 1.2692 84.77 150 17/32
Resistance 1 1627.8 1.2635 83.68 149 26/32
Pivot 1617.4 1.2555 82.91 148 23/32
Support 1 1608.8 1.2498 81.82 148
Support 2 1598.4 1.2418 81.05 146 29/32
Support 3 1589.8 1.2361 79.96 146 6/32

4. Support & Resistance Levels for Corn, Wheat, Beans and Silver

Contract July Corn July Wheat July Beans July Silver
Resistance 3 623.7 626.3 1439.00 2942.8
Resistance 2 612.8 624.0 1431.75 2926.2
Resistance 1 602.7 620.0 1420.00 2903.3
Pivot 591.8 617.8 1412.75 2886.7
Support 1 581.7 613.8 1401.0 2863.8
Support 2 570.8 611.5 1393.75 2847.2
Support 3 560.7 607.5 1382.00 2824.3

5. Economic Reports

source:http://www.forexfactory.com/calendar.php

All times are Eastern time Zone (EST)

Thu

Jun 14

 Up Next 2:00am EUR
German WPI m/m
-0.4%
0.5%
4:00am EUR
ECB Monthly Bulletin
5:00am EUR
CPI y/y
2.4%
2.4%
5:00am EUR
Core CPI y/y
1.6%
1.6%
All Day ALL
OPEC Meetings
8:30am USD
Core CPI m/m
0.2%
0.2%
8:30am USD
Unemployment Claims
377K
377K
8:30am USD
CPI m/m
-0.2%
0.0%
8:30am USD
Current Account
-132B
-124B
10:30am USD
Natural Gas Storage
55B
62B
1:00pm USD
30-y Bond Auction
3.09|2.7

This is not a solicitation of any order to buy or sell, but a current market view provided by Cannon Trading Inc. Any statement of facts herein contained are derived from sources believed to be reliable, but are not guaranteed as to accuracy, nor they purport to be complete. No responsibility is assumed with respect to any such statement or with respect to any expression of opinion herein contained. Readers are urged to exercise their own judgment in trading


Futures Trading Levels & Economic Reports for 06-13 including 180 tick Renko Gold Chart

June 12th, 2012 Filed under Future Trading News | Comments Off on Futures Trading Levels & Economic Reports for 06-13 including 180 tick Renko Gold Chart

Jump to a section in this post:

1. Market Commentary
2. Support and Resistance Levels – S&P, Nasdaq, Dow Jones, Russell 2000, Dollar Index
3. Support and Resistance Levels – Gold, Euro, Crude Oil, T-Bonds
4. Support and Resistance Levels – Corn, Wheat, Beans, Silver
5. Economic Reports for Wednesday June 13, 2012

Hello Traders,

Gold is holding some levels and starting to build somewhat of a bullish base in an attempt to make a run and break the 1641 high from last week?

I think so but in between I wanted to share with you a screen shot from today’s trading session of my intraday gold chart.


180 tick Renko Gold Chart


Would you like to have access to my DIAMOND and TOPAZ ALGOs as shown above and be able to apply for any market and any time frame on your own PC ? You can now have a two weeks free trial where I enable the ALGO along with few studies for your own sierra/ ATcharts IN ADDITION to your free access into the “Live charts/ trading signals” room.

I think so but in between I wanted to share with you a screen shot from today’s trading session of my intraday gold chart.

To start your trial, please visit: https://www.cannontrading.com/tools/intraday-futures-trading-signals

Or
send me an email with the following information:

1. Are you currently trading futures?
2. Charting software you use?
3. If you use sierra or ATcharts, please let me know the user name so I can enable you
4. Markets you currently trading?

Read the rest of this entry »


Tuesday Morning Support and Resistance Numbers

June 12th, 2012 Filed under Future Trading News | Comments Off on Tuesday Morning Support and Resistance Numbers

If you would like these numbers before the market opens, make sure you SIGN UP with your email above.

Here’s a morning cup o’ joe for all you futures traders, our morning support and resistance levels. Good trading!

Support and Resistance Levels – S&P 500, Nasdaq 100, Dow Jones, Mini Russell 2000, 30-Year US Bond, 10-Year US Note

Contract (June) Mini S&P 500 Mini Nasdaq 100 Dow Jones Mini Russell 2000 30-Year US Bond Sep ’12 10-Year US Note Sep ’12
Resistance Level 3 ——————————————

Resistance Level 2

——————————————

Resistance Level 1

——————————————

Support Level 1

——————————————

Support Level 2

——————————————

Support Level 3

1341.5 

1335.75


1331.5


1302


1297


1292.5

2598 

2585


2578


2516


2496


2481.5

12715 

12650


12610


12350


12263


11985

781.1 

776.8


774.2


748.6


744.2


728.5

15021 

15013


14924


14810


14731


14628

13401.5 

13330.5


13324.5


13313.5


13308.5


13303

Read the rest of this entry »


Futures Trading Levels & Economic Reports for 06-12 including Mini S&P daily chart

June 11th, 2012 Filed under Future Trading News | Comments Off on Futures Trading Levels & Economic Reports for 06-12 including Mini S&P daily chart

Jump to a section in this post:

1. Market Commentary
2. Support and Resistance Levels – S&P, Nasdaq, Dow Jones, Russell 2000, Dollar Index
3. Support and Resistance Levels – Gold, Euro, Crude Oil, T-Bonds
4. Support and Resistance Levels – Corn, Wheat, Beans, Silver
5. Economic Reports for Tuesday June 12, 2012

Hello Traders,

Stock index futures pretty much gave up all their gain from Friday session and finished today on a bearish note.

The question is whats ahead for stock index futures and in the case of the chart below, the mini SP 500?

My opinion is that the fundamental news, which are coming out, mostly news from Europe will have importance. Most traders are technical by nature, i.e they make decisions based on chart formations. I fall into this category myself BUT it is important to be aware of economic reports times and different news affecting the markets you trade.

In the case of the mini SP 500 chart seen below, I see both open interest and volume rising while the trend strength is low in this case. Meaning the down trend that developed over last few weeks on the daily chart is not as a strong. That suggests more price action like we have seen over the past few sessions, strong days up, followed by strong days down etc.
My reading is that an hourly close below 1298 level, can trigger the next leg down.

Mini S&P daily chart Read the rest of this entry »

Have A Questions? Open an account Free Demo Account Free Demo Account

Question?

Valid first name is required.
Valid last name is required.
Phone number is required.
E-mail is required.
Message is required.
Phone (USA)
Phone (International)
Our Approach

You and your broker will work together to achieve your trading goals. We develop long term relationships with our clients so that we can grow and improve together.
Learn More About Choosing Cannon

Our Platforms

Please click on one of our platforms below to learn more about them, start a free demo, or open an account.
E-Futures Sierra Charts Firetip (Mac Compatible) RTrader

________
Doing Business With
See more...
Loading
Loading

Loading