Futures Trading Levels & Economic Reports for 06-12 including Mini S&P daily chart
Posted By:- Ilan Levy-Mayer Vice President, Cannon Trading Futures Blog
Jump to a section in this post:
1. Market Commentary
2. Support and Resistance Levels – S&P, Nasdaq, Dow Jones, Russell 2000, Dollar Index
3. Support and Resistance Levels – Gold, Euro, Crude Oil, T-Bonds
4. Support and Resistance Levels – Corn, Wheat, Beans, Silver
5. Economic Reports for Tuesday June 12, 2012
Hello Traders,
Stock index futures pretty much gave up all their gain from Friday session and finished today on a bearish note.
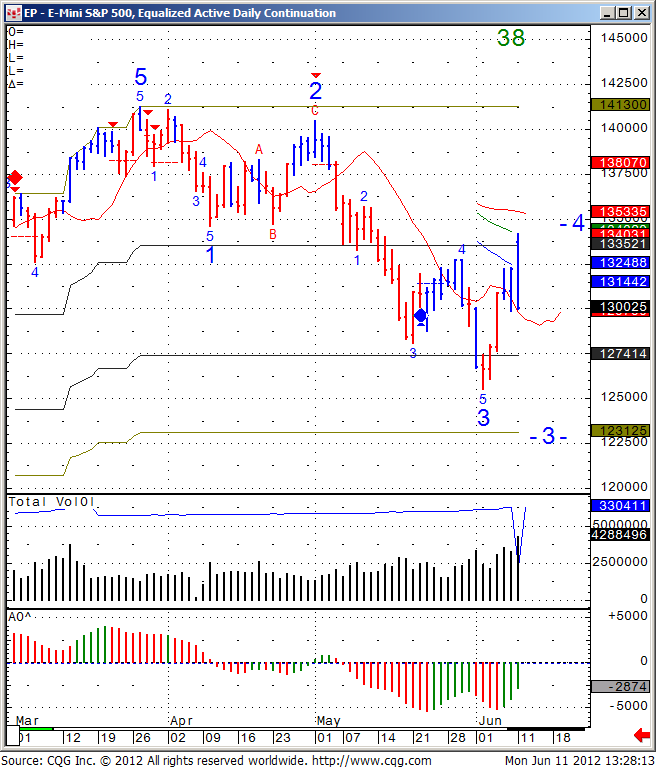
The question is whats ahead for stock index futures and in the case of the chart below, the mini SP 500?
My opinion is that the fundamental news, which are coming out, mostly news from Europe will have importance. Most traders are technical by nature, i.e they make decisions based on chart formations. I fall into this category myself BUT it is important to be aware of economic reports times and different news affecting the markets you trade.
In the case of the mini SP 500 chart seen below, I see both open interest and volume rising while the trend strength is low in this case. Meaning the down trend that developed over last few weeks on the daily chart is not as a strong. That suggests more price action like we have seen over the past few sessions, strong days up, followed by strong days down etc.
My reading is that an hourly close below 1298 level, can trigger the next leg down.

GOOD TRADING!
Trading Futures, Options on Futures, and retail off-exchange foreign currency transactions involves substantial risk of loss and is not suitable for all investors. You should carefully consider whether trading is suitable for you in light of your circumstances, knowledge, and financial resources. You may lose all or more of your initial investment. Opinions, market data, and recommendations are subject to change at any time.
2. Support and Resistance Levels – S&P, Nasdaq, Dow Jones, Russell 2000, Dollar Index
| Contract Sept. 2012 | SP500 (big & Mini) | Nasdaq100 (big & Mini) | Dow Jones (big & Mini) | Mini Russell | Dollar Index |
| Resistance 3 | 1351.33 | 2622.33 | 12752 | 805.83 | 83.87 |
| Resistance 2 | 1340.67 | 2598.17 | 12663 | 793.47 | 83.26 |
| Resistance 1 | 1321.83 | 2556.33 | 12497 | 770.53 | 82.94 |
| Pivot | 1311.17 | 2532.17 | 12408 | 758.17 | 82.33 |
| Support 1 | 1292.33 | 2490.33 | 12242 | 735.23 | 82.01 |
| Support 2 | 1281.67 | 2466.17 | 12153 | 722.87 | 81.40 |
| Support 3 | 1262.83 | 2424.33 | 11987 | 699.93 | 81.08 |
3. Support & Resistance Levels for Gold, Euro, Crude Oil, and U.S. T-Bonds
| Contract | Aug Gold | June Euro | July Crude Oil | Sept. Bonds | |
| Resistance 3 | 1638.8 | 1.2800 | 90.27 | 153 8/32 | |
| Resistance 2 | 1624.0 | 1.2735 | 88.45 | 151 15/32 | |
| Resistance 1 | 1612.2 | 1.2611 | 84.98 | 150 14/32 | |
| Pivot | 1597.4 | 1.2546 | 83.16 | 148 21/32 | |
| Support 1 | 1585.6 | 1.2422 | 79.69 | 147 20/32 | |
| Support 2 | 1570.8 | 1.2357 | 77.87 | 145 27/32 | |
| Support 3 | 1559.0 | 1.2233 | 74.40 | 144 26/32 |
4. Support & Resistance Levels for Corn, Wheat, Beans and Silver
| Contract | July Corn | July Wheat | July Beans | July Silver | |
| Resistance 3 | 610.9 | 645.3 | 1448.33 | 2969.7 | |
| Resistance 2 | 606.3 | 642.2 | 1441.92 | 2934.8 | |
| Resistance 1 | 599.2 | 636.3 | 1433.33 | 2895.2 | |
| Pivot | 594.6 | 633.2 | 1426.92 | 2860.3 | |
| Support 1 | 587.4 | 627.3 | 1418.3 | 2820.7 | |
| Support 2 | 582.8 | 624.2 | 1411.92 | 2785.8 | |
| Support 3 | 575.7 | 618.3 | 1403.33 | 2746.2 |
5. Economic Reports
source:http://www.forexfactory.com/calendar.php
All times are Eastern time Zone (EST)
This is not a solicitation of any order to buy or sell, but a current market view provided by Cannon Trading Inc. Any statement of facts herein contained are derived from sources believed to be reliable, but are not guaranteed as to accuracy, nor they purport to be complete. No responsibility is assumed with respect to any such statement or with respect to any expression of opinion herein contained. Readers are urged to exercise their own judgment in trading


