Trading the 30 Year Bonds In Place of the NQ? 30 Year Bond Chart for Review & Support and Resistance Levels 4.21.2021 - Support & Resistance Levels

Support & Resistance Levels

This Blog provides futures market outlook for different commodities and futures trading markets, mostly stock index futures, as well as support and resistance levels for Crude Oil futures, Gold futures, Euro currency and others. At times the daily trading blog will include educational information about different aspects of commodity and futures trading.

Trading the 30 Year Bonds In Place of the NQ? 30 Year Bond Chart for Review & Support and Resistance Levels 4.21.2021

_________________________________________________

Voted #1 Blog and #1 Brokerage Services on TraderPlanet for 2016!!  

_________________________________________________

Dear Traders,

Like us on FaceBook!
Get Real Time updates and market alerts on Twitter!
Get Real Time updates and more on our private FB group!
Spoke with a client today I have not spoken with in a while and was happy to hear from him that his own day trading improved once he SWITCHED over from NQ to ZB ( mini NASDAQ to T bonds).
Why am I happy you may ask?
  1. Always good to hear your clients trading is improving
  2. I am in believe that different markets are better for different traders and that it is worth while to explore other markets for trading. I personally like to mix and match 3-5 markets . Sometimes even moving from NQ to MNQ can help.
  3. When it comes to short term trading my favorites ( personally) are: ES/MES, MNQ ( I feel NQ can be too much at these price levels and you probably need $30k to day trade 1 NQ ), CL, GC, ZB, ZS
Here is something I wrote on bonds a while back and worth sharing:
Each market has a different personality, different behavior along with different times of the day when it is most active. If you are finding that the ES (mini SP) is not giving you enough OR too much risk/opportunities then start monitoring a couple of other markets and perhaps explore them in demo / simulated mode.
I think that there are more than a few markets that are suitable for day-trading. Below you will find some observations, tips along with what are unique about these markets, personality and most active trading hours (interest rates, mostly the ten year and 30 year).
In most platforms, the symbols are ZB for 30 year bonds and ZN for 10 year notes.
Product Symbol
ZB
Contract Size
The unit of trading shall be U.S. Treasury Bonds having a face value at maturity of one hundred thousand dollars ($100,000) or multiples thereof
Price Quotation
Points ($1,000) and 1/32 of a point. For example, 134-16 represents 134 16/32. Par is on the basis of 100 points.
Product Symbol
ZN
Underlying Unit
One U.S. Treasury note having a face value at maturity of $100,000.
Deliverable Grades
U.S. Treasury notes with a remaining term to maturity of at least six and a half years, but not more than 10 years, from the first day of the delivery month. The invoice price equals the futures settlement price times a conversion factor, plus accrued interest. The conversion factor is the price of the delivered note ($1 par value) to yield 6 percent.
Price Quote
Points ($1,000) and halves of 1/32 of a point. For example, 126-16 represents 126 16/32 and 126-165 represents 126 16.5/32. Par is on the basis of 100 points.
Tick Size
(minimum fluctuation)
One-half of one thirty-second (1/32) of one point ($15.625, rounded up to the nearest cent per contract), except for intermonth spreads, where the minimum price fluctuation shall be one-quarter of one thirty-second of one point ($7.8125 per contract).
Contract Months
The first five consecutive contracts in the March, June, September, and December quarterly cycle.
These contracts are often affected by many of the economic reports that come out at 8:30 AM Eastern and there is very active volume between the hours of 8 AM EST and 3 PM EST
Volume on both contracts is very good. Ten years will often have 1 million contracts traded per day (might be the second most active US futures market after the mini SP 500) and the bonds will avg. around 300,000 contracts.
These markets can experience very volatile movements during and right after different reports but then will often trade smooth or in an intraday trend the rest of the day.
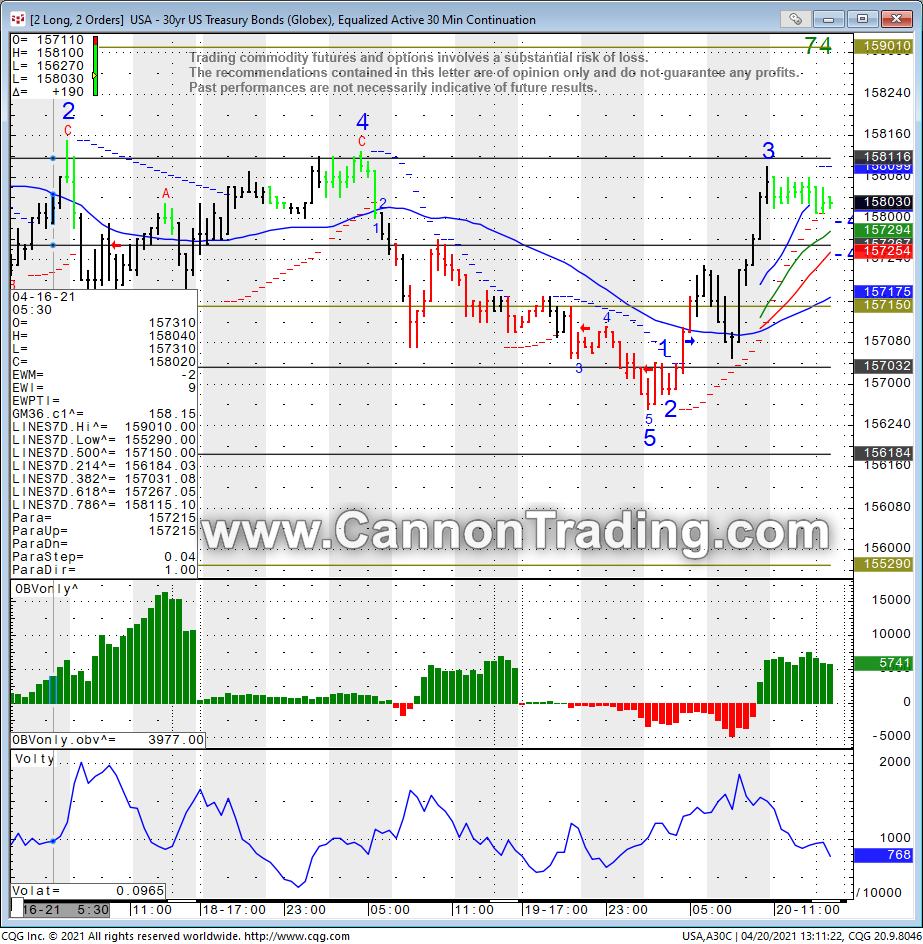
30 MINUTES chart of ZB ( t-bond futures) for your review below
30 Year Bond Futures Chart
To access a free trial to the ALGOS shown in the chart along with other tools? (Slanted arrows possible buy, pink squares = possible exit/ tighten stops) visit and sign up for a free trial for 21 days with real-time data.

Good Trading

Trading Futures, Options on Futures, and retail off-exchange foreign currency transactions involves substantial risk of loss and is not suitable for all investors.  You should carefully consider whether trading is suitable for you in light of your circumstances, knowledge, and financial resources. You may lose all or more of your initial investment. Opinions, market data, and recommendations are subject to change at any time when it comes to Futures Trading.


Futures Trading Levels

4-21-2021

c

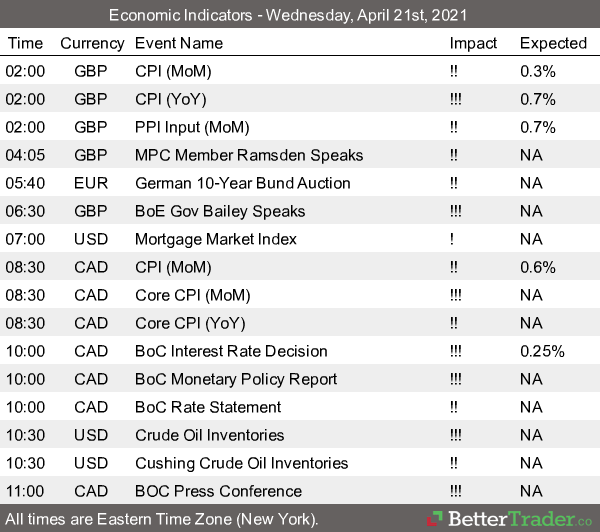
Economic Reports, source: 

 www.BetterTrader.co


This is not a solicitation of any order to buy or sell, but a current market view provided by Cannon Trading Inc. Any statement of facts here in contained are derived from sources believed to be reliable, but are not guaranteed as to accuracy, nor they purport to be complete. No responsibility is assumed with respect to any such statement or with respect to any expression of opinion herein contained. Readers are urged to exercise their own judgement in trading.

Posted in: Future Trading News  

Trading Expertise As Featured In

Trading Tips You Can Use Right Away!


Watch 4 short videos on the topics of:
  • Using Bollinger Bands and Parabolics
  • Using range Bars for Day-Trading
  • The concept of Price Confirmation
  • How to Use Support & Resistance Levels
  • License 3 Broker at your Fingertips
Loading
Loading

Loading
Loading
Loading

Loading