Weekly Newsletter 1122: Volume Profile, Order Flow & Footprint Charts + Levels for November 7th
Posted By:- Ilan Levy-Mayer Vice President, Cannon Trading Futures Blog
Cannon Futures Weekly Newsletter Issue # 1122
If you’re not living in Arizona, Hawaii or a few other U.S. territories, get ready to wave goodbye to Daylight Savings Time. This Sunday at 2:00 A.M., local time (that’s right, each time zone switches at a different time) set your clocks back one hour and welcome back to Standard Time.
VolSys (Volumetrica Trading) is a professional trading platform which its main goal is the analysis of the volume profiles, time and sales, order flow and footprint all developed by a group of individual traders.
The trading platform has all you need for fast and convenient market evaluation – Adv. Time And Sales, Adv. Chart, Correlation Viewer and HFT algorithms tracking. Our platforms process the order flow data and display it in an innovative and intuitive way.
The Trading platform provides one-click chart and DOM trading in order to help scalper and day traders.
VolSys offers the most powerful indicators (Volume Profile, Order Flow Analyzer, Footpring etc) in order to understand the market movements through the volume analysis, while VolBook offers an innovative way to view the depth of the market.
Hot Market
FOMC and non Farm Payrolls are behind us but Election week is next….
Will it test?
Will it hold support?
If it breaks below what are the next levels?

Emini Nasdaq Futures Daily Continuation Chart
Futures Trading Levels
11-07-2022
Daily Levels

SP500 #ES_FNasdaq100 #NQ_FDow Jones #YM_FMini Russell #RTY_FBitCoin Index #BRTI SP500 Dec. Gold #GC_F Dec. Silver #SI_F Oct. Crude Oil #CL-F Dec. Bonds #ZB_F Dec. 10 yr #ZN_F Dec. Corn #ZC_F Dec. Wheat #ZW_F Nov. Beans #ZS_F Dec. SoyMeal #ZM_F Oct. Nat Gas #NG_F Dec. Coffee #KC_F Dec. Cocoa #CC_F October Sugar #SB_F Dec. Cotton #CT_F Sept. Euro Currency
Weekly Levels

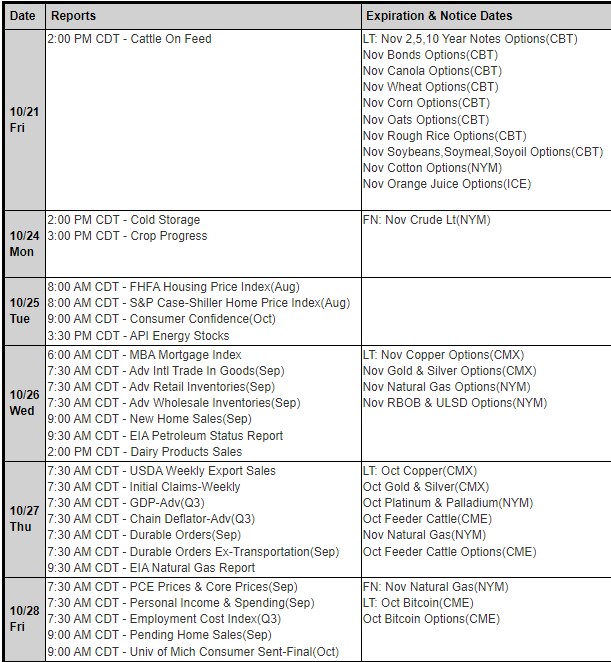
Reports, First Notice (FN), Last trading (LT) Days for the Week:
https://mrci.com
Date Reports/Expiration Notice Dates
This is not a solicitation of any order to buy or sell, but a current market view provided by Cannon Trading Inc. Any statement of facts herein contained are derived from sources believed to be reliable but are not guaranteed as to accuracy, nor they purport to be complete. No responsibility is assumed with respect to any such statement or with respect to any expression of opinion herein contained. Readers are urged to exercise their own judgment in trading
Posted in: Charts & Indicators | Future Trading Platform | Index Futures | Indices | Weekly Newsletter


