Corn Futures Archives - Support & Resistance Levels

Corn Futures

Category Archives: Corn Futures


“Voice from the Tomb”: Legendary Grain Trader’s Seasonal Wisdom Revealed

June 25th, 2024 Filed under Commodity Brokers, Commodity Trading, Corn Futures, Day Trading, Future Trading News, Futures Broker, Futures Trading, Grain Futures | Comment (0)

Get Real Time updates and more by joining our Private Facebook Group!
Subscribe to our YouTube Channel
Listen to our Market Recap Podcasts on Apple Podcasts


In light of this weeks impactful “Grain Stocks” report out Friday morning

by John Thorpe, Senior Broker:


This 8 ½ x 11, well worn, sheet of paper version has been pinned to the corkboard in my office for decades and is worth a share. Called “Voice from the Tomb”, I have noticed a web page dedicated solely to this Myth or Non Fiction? Lore or Fact? and his experiences following the execution dates.

It’s interesting to contemplate the prospective impact of following the note left to family members, in light of some of the upcoming dates provided. What follows is simply a brief of the contents, feel free to google search the topic to follow the trader’s experiences, you too may end up saving the primary authors advice.


Voice From The Tomb


This is the legend of a wise grain trader that made a fortune trading “seasonals” in the pits of the Chicago Board of Trade.

“After his wife died, a millionaire grain trader dedicated his life to raising their children. The children were lazy and thought they’d inherit all of their father’s money. He felt that his children were wasteful and believed they took him for granted. When he died, all the money went to charity. All he left them in his will were the following dates of when to buy and sell. The will said that if they strictly followed his advice, they’d have the fortunes they always thought were going to drop in their laps.”

So what is a “seasonal”? “Seasonality often plays a part in determining prices for commodities in regular cycles throughout the year. Normal increases and decreases in supply and demand for particular commodities seem to occur every year in fairly consistent patterns. Commodity seasonal patterns might appear to be an easy trading strategy for commodities, but seasonal tendencies are just that – tendencies.” Chuck Kowalski


  • Sell March Wheat on January 10
  • Buy May and/or July Wheat on February 22
  • Sell July Wheat on May 10
  • Buy December Wheat on July 1
  • Sell December Wheat on September 10
  • Buy March Wheat on November 28


Corn

  • Buy July Corn on March 1
  • Sell July Corn on May 20
  • Buy December Corn on June 25
  • Sell December and March Corn on August 10

 Disclaimers:

* Past results are not necessarily indicative of future results. The risk of loss in the futures trading market can be substantial, carefully consider the inherent risks of such an investment in light of your financial condition.

** SEASONAL TENDENCIES ARE A COMPOSITE OF SOME OF THE MORE CONSISTENT COMMODITY FUTURES SEASONAL THAT HAVE OCCURRED OVER THE PAST 15 YEARS. THERE ARE USUALLY UNDERLYING FUNDAMENTAL CIRCUMSTANCES THAT OCCUR ANNUALLY THAT TEND TO CAUSE THE FUTURES TRADING MARKETS TO REACT IN A SIMILAR DIRECTIONAL MANNER DURING A CERTAIN CALENDAR PERIOD OF THE YEAR. EVEN IF A SEASONAL TENDENCY OCCURS IN THE FUTURE, IT MAY NOT RESULT IN A PROFITABLE TRANSACTION AS FEES, AND THE TIMING OF THE ENTRY AND LIQUIDATION MAY IMPACT ON THE RESULTS. NO REPRESENTATION IS BEING MADE THAT ANY ACCOUNT HAS IN THE PAST OR WILL IN THE FUTURE ACHIEVE PROFITS UTILIZING THESE STRATEGIES. NO REPRESENTATION IS BEING MADE THAT PRICE PATTERNS WILL RECUR IN THE FUTURE.


If you are a day trader, below you will see markets that our proprietary ALGO has identified as being more suitable for attacking either from the long side or the short side for the next trading session.

Questions? We are happy to help!


Daily Levels for June 26th, 2024

Economic Reports
provided by: ForexFactory.com
All times are Eastern Time ( New York)

Improve Your Trading Skills

Get access to proprietary indicators and trading methods, consult with an experienced broker at 1-800-454-9572.

Explore trading methods. Register Here

* This is not a solicitation of any order to buy or sell, but a current market view provided by Cannon Trading Inc. Any statement of facts here in contained are derived from sources believed to be reliable, but are not guaranteed as to accuracy, nor they purport to be complete. No responsibility is assumed with respect to any such statement or with respect to any expression of opinion herein contained. Readers are urged to exercise their own judgement in trading.


Market Analysis: Grain Futures Trends Amidst Technical Shifts

June 3rd, 2024 Filed under Commodity Brokers, Commodity Trading, Corn Futures, Day Trading, Future Trading News, Futures Broker, Futures Trading, Trading Guide | Comment (0)

Get Real Time updates and more by joining our Private Facebook Group!
Subscribe to our YouTube Channel
Listen to our Market Recap Podcasts on Apple Podcasts


June Grain Comment

By John Thorpe, Senior Broker


Corn was the first of the spring time grain bulls to negate recent uptrends with bears officially seizing technical control of July contract with a crossover Moving Average on May 29th  and hasn’t looked back; on that day the contract closed at $5.05 – BU; todays close was $4.88. ¾ – BU. I would expect a range trade for the rest of this month up until the July 4th vacation, when trends can quickly reverse.

The Soybean market was next : Friday saw the technical damage done when the Crossover Moving Average reflected an outright sell with a closing price of $12.05 -BU. 53 cents off it’s May 23rd high. Also negating the bullish spring time sentiment that ordinarily comes with a weather market. July Soybeans closed @11.84 ½ down .20 ½ from Fridays settlement. As recent price uptrends on the daily graphs have been negated, it appears, this market at best, will trade sideways between $11.50 and $12.20/BU

The best option strategies for sideways markets include, “Short Strangle”,” Iron Condor” , “Short Straddle” and “Iron Butterfly” please consult with your Cannon Broker if you have any questions about these or other strategies you can utilize in perceived side-ways markets.

The Lone holdout in the row crops and still in a very strong bull trend is the Wheat market. This springtime bull rally began mid April in the $5.60 – bu area and has gone as high as $7.20 – bu May 28th. Today we closed at $6.72 ¾ – bu down 5 ¾ from Friday’s close all done within a 30 cent range today!.

We haven’t yet done much technical damage, a close below 6.56 could trigger a sell, it’s wait and see here.

Although Wheat can move sympathetically with corn and beans, like today, it wouldn’t surprise us to see Wheat buck the trend and maintain it’s bullish technical credentials, this could be the “buy the Dip” moment with a reasonable risk management stop or put to cover.

If you are a day trader, below you will see markets that our proprietary ALGO has identified as being more suitable for attacking either from the long side or the short side for the next trading session.

Questions? We are happy to help!


Daily Levels for June 4th, 2024


Economic Reports
provided by: ForexFactory.com
All times are Eastern Time ( New York)

Improve Your Trading Skills

Get access to proprietary indicators and trading methods, consult with an experienced broker at 1-800-454-9572.

Explore trading methods. Register Here

* This is not a solicitation of any order to buy or sell, but a current market view provided by Cannon Trading Inc. Any statement of facts here in contained are derived from sources believed to be reliable, but are not guaranteed as to accuracy, nor they purport to be complete. No responsibility is assumed with respect to any such statement or with respect to any expression of opinion herein contained. Readers are urged to exercise their own judgement in trading.


Mastering Vertical Spreads: A Guide to Risk-Defined Options Strategies + Trading Levels for June 3rd

May 31st, 2024 Filed under Charts & Indicators, Commodity Brokers, Commodity Trading, Corn Futures, Day Trading, E-Mini Futures, Energy Futures, Future Trading News, Futures Broker, Futures Trading, futures trading education, Options Trading, Weekly Newsletter | Comment (0)

Get Real Time updates and more by joining our Private Facebook Group!
Subscribe to our YouTube Channel

Cannon Futures Weekly Letter Issue # 1196

In this issue:
  • Important Notices – Non Farm Payrolls is the main event
  • Futures 101 – Vertical Option Spreads
  • Hot Market of the Week –
  • Broker’s Trading System of the Week – Crude Oil Day Trading System
  • Trading Levels for Next Week
  • Trading Reports for Next Week


Important Notices – Next Week Highlights:

  • Light Earnings week: Crowdstrike, LULULemon, Dollar Tree and HP are the 4 headliners
  • FOMC Blackout Period Begins in advance of the June 11-12 FOMC Mtg.
  • Econ Data: ISM MFG PMI Mon., JOLTS Tues., ISM SVCS PMI Wed, Jobless Claims Thur, NON Farm Payrolls B4 the open Fri.
  • August gold is front month
  • September is front month for bonds, 10 years, 5/2 notes.


Futures 101 :

Vertical Spreads

By Craig Bewick CMEGroup.com
“Vertical Spreads” involve buying (selling) a higher strike price option and selling (buying) a lower strike price option and can be executed with either Calls or Puts.
  • If a trader sells the lower strike CALL option and buys the higher strike CALL option, they would receive a CREDIT (the lower strike Call will trade at a higher price than the higher strike Call) for that trade. Selling the higher strike and buying the lower strike CALL would result in a DEBIT. The opposite is true if the trader executed a PUT spread.
These spreads are known as “risk defined” strategies because the max potential profit and loss is known to the trader at the time of execution.
If we hold all other variables constant, Call and Put Vertical spreads represent a bullish or bearish view on the price of the underlying instrument:
  • Long (debit) Call spreads and Short (credit) Put spreads represent a bullish view
  • Short (credit) Call spreads and Long (debit) Put spreads represent a bearish view
Of course, as with most options strategies, several factors, including volatility, can also impact the value of vertical spreads, as we’ll demonstrate below.
EXAMPLE:
Let’s look at a real-life example using E-mini S&P 500 options:
Using markets from 4/25 @ 10:35 AM CST, we selected the following options:
Futures: 5,038
Sell 1 5,090 Call | Premium 58.25 | IV: 14.3% | Delta: -.41 | Gamma: -.0019 | Vega: -550.8 | Theta: 1.35
Buy 1 5,130 Call | Premium 42.0 | IV: 13.9% | Delta: .33 | Gamma: .0018 | Vega: 513.8 | Theta: -1.23
Position: Delta: -.08 | Gamma: -.0001 | Vega: -37 | Theta: .12
Max profit and loss (excluding all fees and commissions):
  • The max profit that this position could realize is the credit taken in at execution
  • 58.25-42.0 = 16.25 pts (16.25*$50 = $812.50)
  • The max loss that this position could realize is the credit taken in minus the difference between the strike prices
  • 16.25-40.00 = 23.75 pts (23.75*$50 = $1,187.50)
  • The P&L graph of each option and the overall P&L is shown in the TOP image below
Short 5090 Call (Blue Line)
  • 58.25 points were collected at execution on the 5090 Call. At any price below 5090 at expiry, this option is worthless and the trader will keep the premium collected (58.25).
  • As the price rises above 5090, the option gains value incrementally which, because this position is short, has a negative impact on the P&L.
Long 5130 Call (Orange Line)
  • 42 points were paid at the execution of the 5130 Call. This option, at expiry, is worthless at any futures price at, or under, 5130.
  • Similar to the 5090, as the price rises above 5130, the option gains value incrementally, which, in this case, has a positive impact on the P&L.
Position P&L
  • They gray line represents the overall P&L of the position at expiration, based on the futures price on the X-axis. This is simply the addition of the value of the blue and orange lines.
P&L Scenarios Prior to Expiration
However, though the max profit and loss is defined at the entry point of the trade, as we mentioned earlier, because option pricing is multi-dimensional, factors like volatility and time can impact the value of the position between execution and expiration. Although it is impossible to illustrate all the different values at which this option could theoretically trade because of the dynamic nature of options pricing, we wanted to illustrate some “what-if” scenarios to demonstrate how things like implied volatility and time decay might impact the position. These are illustrated in the bottom image below.


  • Hot Market of the Week – December Corn

Hot market of the week is provided by QT Market Center, A Swiss army knife charting package that’s not just for Hedgers, Cooperatives and Farmers alike but also for Spread traders, Swing traders and shorter time frame application for intraday traders with a unique proprietary indicator that can be applied to your specific trading needs.
Dec Corn
The rally in December corn ran out of momentum after completing a second upside PriceCount objective. Now, on the correction lower the chart has activated downside counts too. The first downside objective project a run to the $4.61 area. It takes a trade below $4.56 1/2 to formally negate the remaining unmet upside counts
PriceCounts – Not about where we’ve been , but where we might be going next!
The PriceCount study is a tool that can help to project the distance of a move in price. The counts are not intended to be an ‘exact’ science but rather offer a target area for the four objectives which are based off the first leg of a move with each subsequent count having a smaller percentage of being achieved. It is normal for the chart to react by correcting or consolidating at an objective and then either resuming its move or reversing trend. Best utilized in conjunction with other technical tools, PriceCounts offer one more way to analyze charts and help to manage your positions and risk. Learn more at www.qtchartoftheday.com
Trading in futures, options, securities, derivatives or OTC products entails significant risks which must be understood prior to trading and may not be appropriate for all investors. Past performance of actual trades or strategies is not necessarily indicative of future results.

   Broker’s Trading System of the Week

With algorithmic trading systems becoming more prevalent in portfolio diversification, the following system has been selected as the broker’s choice for this month.

Agora Crude

PRODUCT
SYSTEM TYPE
Swing
Recommended Cannon Trading Starting Capital
$20,000
COST
USD 70 / monthly

The performance shown above is hypothetical in that the chart represents returns in a model account. The model account rises or falls by the average single contract profit and loss achieved by clients trading actual money pursuant to the listed system’s trading signals on the appropriate dates (client fills), or if no actual client profit or loss available – by the hypothetical single contract profit and loss of trades generated by the system’s trading signals on that day in real time (real‐time) less slippage, or if no real time profit or loss available – by the hypothetical single contract profit and loss of trades generated by running the system logic backwards on back adjusted data. Please read full disclaimer HERE.
Would you like to receive daily support & resistance levels?
Yes
No
If you are a day trader, below you will see markets that our proprietary ALGO has identified as being more suitable for attacking either from the long side or the short side.

Daily Levels for June 3rd 2024

Trading Reports for Next Week

First Notice (FN), Last trading (LT) Days for the Week:

Improve Your Trading Skills

Get access to proprietary indicators and trading methods, consult with an experienced broker at 1-800-454-9572.

Explore trading methods. Register Here

* This is not a solicitation of any order to buy or sell, but a current market view provided by Cannon Trading Inc. Any statement of facts here in contained are derived from sources believed to be reliable, but are not guaranteed as to accuracy, nor they purport to be complete. No responsibility is assumed with respect to any such statement or with respect to any expression of opinion herein contained. Readers are urged to exercise their own judgement in trading.


GDP Tomorrow, Earnings Season in Full Play  + Levels for April 25th

April 24th, 2024 Filed under Charts & Indicators, Commodity Brokers, Commodity Trading, Corn Futures, Day Trading, Future Trading News, Futures Broker, Futures Trading, Grain Futures | Comment (0)

Get Real Time updates and more by joining our Private Facebook Group!
Subscribe to our YouTube Channel


A few tips for tomorrow:

  • If you are trading stock index futures, note price action has been VERY choppy during the day session as most earnings come out after the close…
  • Coffee and Coca volatility is as high as I have seen in recent months. Large intraday and overnight moves in both, as much as +/- 8% per day!
  • We have GDP and home sales tomorrow.
  • Big pullback in both silver and gold and the key question is: Was this profit taking/ deflation of geo political fear and GOOD entry to the long side? OR…is this the near term top for both markets??
  • Corn daily chart for your review below.


Daily Levels for April 25th, 2024

Economic Reports
provided by: ForexFactory.com
All times are Eastern Time ( New York)

Improve Your Trading Skills

Get access to proprietary indicators and trading methods, consult with an experienced broker at 1-800-454-9572.

Explore trading methods. Register Here

* This is not a solicitation of any order to buy or sell, but a current market view provided by Cannon Trading Inc. Any statement of facts here in contained are derived from sources believed to be reliable, but are not guaranteed as to accuracy, nor they purport to be complete. No responsibility is assumed with respect to any such statement or with respect to any expression of opinion herein contained. Readers are urged to exercise their own judgement in trading.


Weekly Newsletter: How to Trade Economic Reports + Futures Trading Levels for Oct. 23rd

October 27th, 2023 Filed under Charts & Indicators, Commodity Brokers, Commodity Trading, Corn Futures, Crude Oil, Day Trading, Energy Futures, Future Trading News, Future Trading Platform, Futures Broker, Futures Exchange, Futures Trading, futures trading education, Trading Wheat Futures, Weekly Newsletter | Comment (0)

Cannon Futures Weekly Newsletter Issue # 1168


Join our private Facebook group for additional insight into trading and the futures markets!

In this issue:

  •  Important Notices – Trading Contest/Real Cash Prizes
  • Trading Resource of the Week – Trading Around Economic Reports
  • Hot Market of the Week – December Cotton
  • Broker’s Trading System of the Week – ES Swing Trading System
  • Trading Levels for Next Week
  • Trading Reports for Next Week
  • Important Notices

Trading Contest – Win Real Cash Trading Simulated Account!
Energy Futures Trading Competition
Duration 
Start: October 15th at 5:00 PM CT
End: October 27th at 4:00 PM CT
Prizes (Cash Prizes!!)
First Place: $2500
Second Place: $1000
Third Place: $650
Random Selection: $500

Competition Details

  • Trade any Group Energy Futures Products including Crude Oil, Micro Crude Oil, RBOB Gasoline, and Natural Gas
  • All Trading will be in the Front-Month Contract
  • All trades will be completed in the StoneX Trader Simulated Trading Environment using the white-labeled Contest Trader application
  • All traders will begin with a virtual account of $100,000.00 Your goal: increase the balance to as much as possible by the conclusion of the competition.
  • Top three traders with the highest P&L balance at the end will get a cash prize.
  • One winner will be chosen from the remaining participants to receive a cash prize.
  • The prizes to the winners shall be awarded in the form of a check (or any other form as reasonably determined by StoneX) and sent to the winner within ten business days of receiving the required tax documentation.

REGISTER NOW

  • Trading Resource of the Week 

Trading Key Economic Reports

As a trader, you will come across many factors that you must consider before entering or exiting the markets. Some of the most important aspects to look for are economic events that can move the markets drastically one way or another.
There are many types of economic events including releases by a governing body, changes in sales or consumption of commodities, and increases in supply and demand. All of these can affect the markets you trade, making it important for you to know how and when these changes are happening.
In this “Trading Around Key Economic Reports” FREE Course you will learn:
  • What is GDP?
  • About the Retail Sales Report
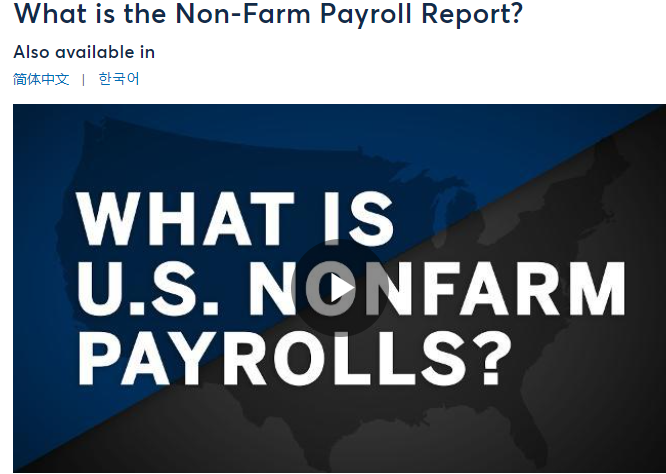
  • What is NFP ( non farm payroll) Report?
  • Understanding US housing Data
  • FOMC
  • Understanding Oil Data Report
  • Importance of Consumer Confidence Survey

ACCESS THE COURSE NOW

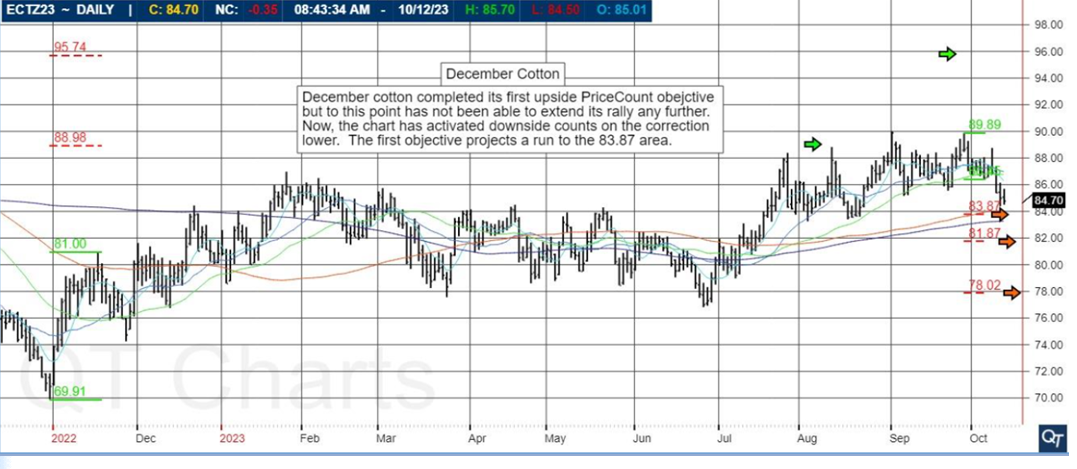
Hot market of the week is provided by QT Market Center, A swiss army knife charting package that’s not just for Hedgers, Cooperatives and Farmers alike but also for Spread traders, Swing traders and shorter time frame application for intraday traders with a unique proprietary indicator that can be applied to your specific trading needs.
December Cotton completed its first upside PriceCount objective but to this point has not been able to extend its rally any further. Now, the chart has activated downside counts on the correction lower. The first objective projects a run to the 83.87 area.
PriceCounts – Not about where we’ve been , but where we might be going next!
The PriceCount study is a tool that can help to project the distance of a move in price. The counts are not intended to be an ‘exact’ science but rather offer a target area for the four objectives which are based off the first leg of a move with each subsequent count having a smaller percentage of being achieved. It is normal for the chart to react by correcting or consolidating at an objective and then either resuming its move or reversing trend. Best utilized in conjunction with other technical tools, PriceCounts offer one more way to analyze charts and help to manage your positions and risk. Learn more at www.qtchartoftheday.com
Trading in futures, options, securities, derivatives or OTC products entails significant risks which must be understood prior to trading and may not be appropriate for all investors. Past performance of actual trades or strategies is not necessarily indicative of future results.
  • Broker’s Trading System of the Week

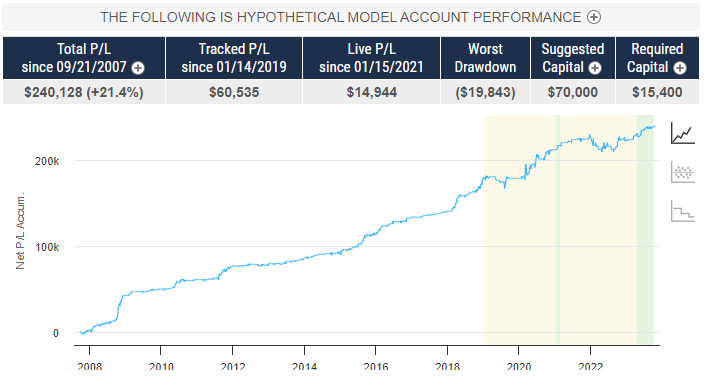
With algorithmic trading systems becoming more prevalent in portfolio diversification, the following system has been selected as the broker’s choice for this month.
PRODUCT
SYSTEM TYPE
Swing
Recommended Cannon Trading Starting Capital
$30,000.00
COST
USD 127 / monthly
The performance shown above is hypothetical in that the chart represents returns in a model account. The model account rises or falls by the average single contract profit and loss achieved by clients trading actual money pursuant to the listed system’s trading signals on the appropriate dates (client fills), or if no actual client profit or loss available – by the hypothetical single contract profit and loss of trades generated by the system’s trading signals on that day in real time (real‐time) less slippage, or if no real time profit or loss available – by the hypothetical single contract profit and loss of trades generated by running the system logic backwards on back adjusted data. Please read full disclaimer HERE.
Sign Up for a Free Personalized Consultation with a Broker from Cannon Trading Company
Questions about the markets? trading? platforms? technology? trading systems? Get answers with a complimentary, confidential consultation with a Cannon Trading Company series 3 broker.
Would you like to receive daily support & resistance levels?
Yes
No


  • Trading Levels for Next Week

Daily Levels for October 13th, 2023
#ES, #NQ, #YM, #RTY, #XBT, #GC, #SI, #CL, #ZB, #6E, #ZC, #ZW, #ZS, #ZM, #NG

#ES, #NQ, #YM, #RTY, #XBT, #GC, #SI, #CL, #ZB, #6E, #ZC, #ZW, #ZS, #ZM, #NG

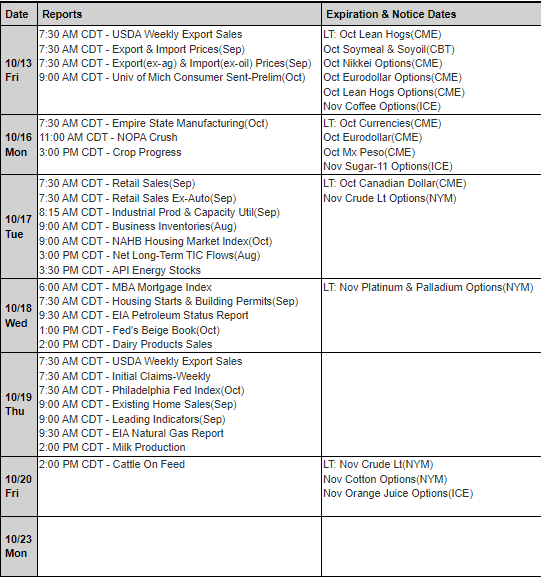
Trading Reports for Next Week
First Notice (FN), Last trading (LT) Days for the Week: www.mrci.com 

This is not a solicitation of any order to buy or sell, but a current market view provided by Cannon Trading Inc. Any statement of facts herein contained are derived from sources believed to be reliable but are not guaranteed as to accuracy, nor they purport to be complete. No responsibility is assumed with respect to any such statement or with respect to any expression of opinion herein contained. Readers are urged to exercise their own judgment in trading.


Good Trading!
Trading Futures, Options on Futures, and retail off-exchange foreign currency transactions involves substantial risk of loss and is not suitable for all investors. You should carefully consider whether trading is suitable for you in light of your circumstances, knowledge, and financial resources. You may lose all or more of your initial investment. Opinions, market data, and recommendations are subject to change at any time.
Have A Questions? Open an account Free Demo Account Free Demo Account

Question?

Valid first name is required.
Valid last name is required.
Phone number is required.
E-mail is required.
Message is required.
Phone (USA)
Phone (International)
Our Approach

You and your broker will work together to achieve your trading goals. We develop long term relationships with our clients so that we can grow and improve together.
Learn More About Choosing Cannon

Our Platforms

Please click on one of our platforms below to learn more about them, start a free demo, or open an account.
E-Futures Sierra Charts Firetip (Mac Compatible) RTrader

Trading Tips You Can Use Right Away!


Watch 4 short videos on the topics of:
  • Using Bollinger Bands and Parabolics
  • Using range Bars for Day-Trading
  • The concept of Price Confirmation
  • How to Use Support & Resistance Levels
  • License 3 Broker at your Fingertips
________
Doing Business With
See more...
Loading
Loading

Loading