Monday Market wrap
By John Thorpe, Senior broker
July orange juice continued to make contract highs @ 4.5325 but couldn’t hang on to that historic level and closed down@ 4.4595 down $2.50
Batman where did all the Copper go?
Where is the supply of this non ferrous asset Robin?
Supply tightness globally has changed market sentiment to “you can’t bring copper onto the market quickly” continued concerns about the ability to ramp up production in Panama, Peru and Chile are being reflected in historic highs and a continuing increase in longs from Friday’s CFTC Commitment of trader’s report.
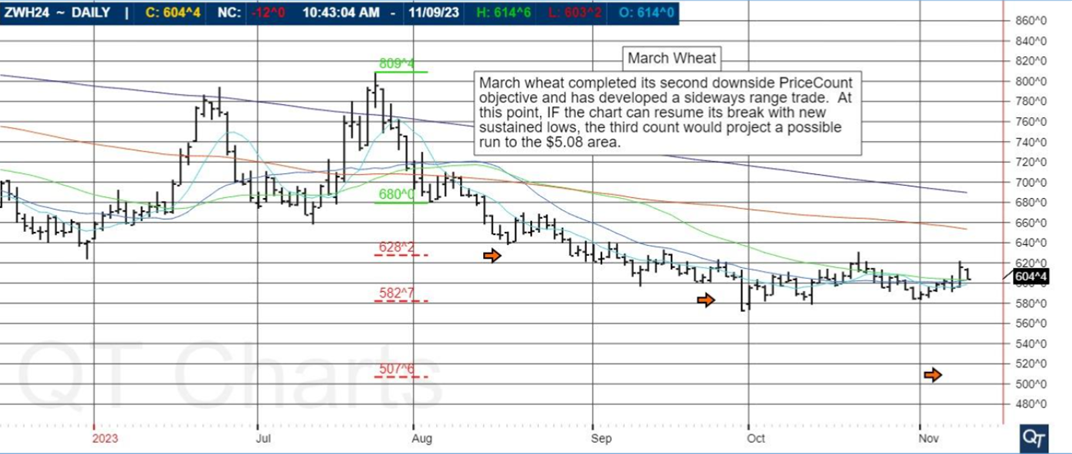
The Gluten is back! And the Wheat is rising!
SRW Chicago Wheat saw its prices move near “limit Up” with the July contract closing up 5.64% or 36 ¼ cents or $1800.00 per contract at $6.88 per bushel. ( limit up in all wheat contracts is .40 https://www.cmegroup.com/trading/price-limits.html )
The HRW KC Wheat was not far behind, up 34 cents and the Minneapolis spring wheat Rallied .27 ¾.
Weather remains the key driver of the moment as ongoing dryness and the recent frost/freeze events turning to hot weather in S Russia and surrounding crop areas in Ukraine and Kazakhstan are further trimming wheat and canola production ideas Here at home, waves of rain have slowed the pace of planting which is adding to the overall row crop supply side anxiety in the trade where funds have been working to get less short this month. For this afternoon’s crop progress report. We look for Spring wheat to advance from 61% planted last week to 75% vs. 73% average. Winter wheat conditions steady at 50% G/E.
These are Weather markets , talk to your broker about seasonal price tendencies and they are just that, tendencies.
Stocks are holding firm, waiting for the FOMC minutes to be read on Wednesday.
Gold and Silver are clearly in an inflationary trance, expect higher volatility to continue for weeks to come.
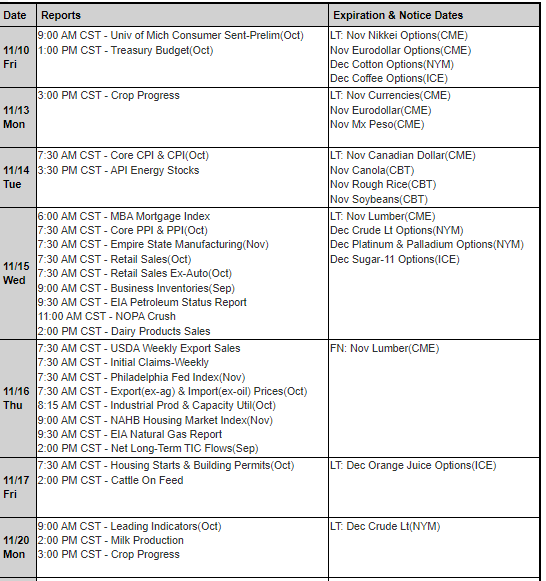
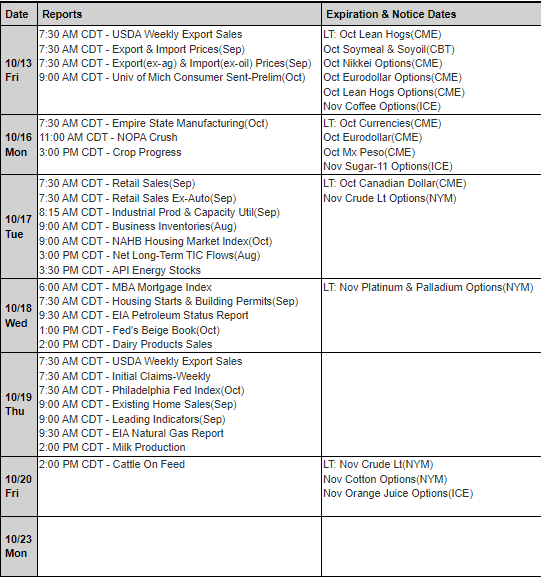
Memorial Day is next Monday, see schedule below.

If you are a day trader, below you will see markets that our proprietary ALGO has identified as being more suitable for attacking either from the long side or the short side for the next trading session.
Questions? We are happy to help!


Daily Levels for May 21st, 2024


Improve Your Trading Skills
Get access to proprietary indicators and trading methods, consult with an experienced broker at 1-800-454-9572.
Explore trading methods. Register Here

* This is not a solicitation of any order to buy or sell, but a current market view provided by Cannon Trading Inc. Any statement of facts here in contained are derived from sources believed to be reliable, but are not guaranteed as to accuracy, nor they purport to be complete. No responsibility is assumed with respect to any such statement or with respect to any expression of opinion herein contained. Readers are urged to exercise their own judgement in trading.