Cannon Futures Weekly Newsletter Issue # 1149
Join our private Facebook group for additional insight into trading and the futures markets!
Have a safe Memorial Day Weekend. Trading Schedule HERE
In this issue:
- Important Notices – Rollover Notice
- Trading Resource of the Week – Trading Pattern: Rising Wedge also known as Ascending Triangle
- Hot Market of the Week – July Unleaded Gasoline
- Broker’s Trading System of the Week – Unleaded Gas Swing Trading System
- Trading Levels for Next Week
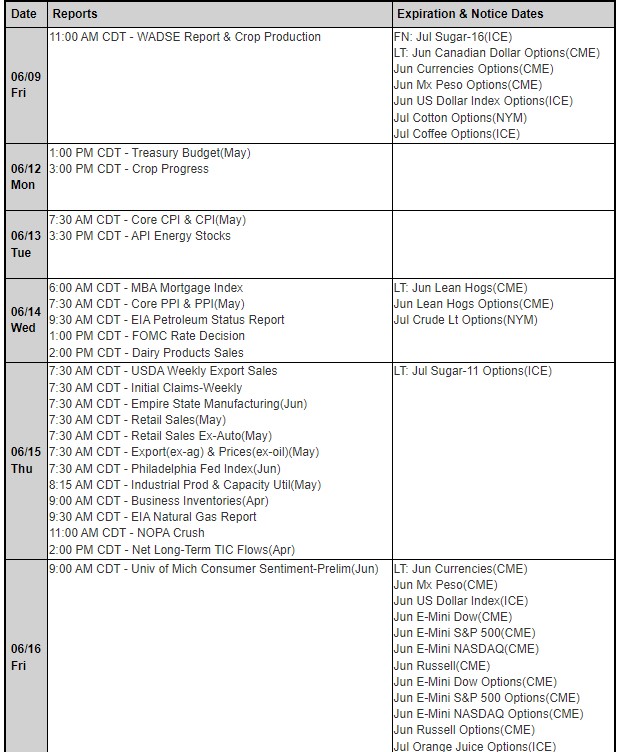
- Trading Reports for Next Week
-
Important Notices – Rollover Notice
I personally start trading September this Monday when the volume on September is higher than the June.
Volume in the June contracts will begin to drop off until their expiration next Friday, June 16th (8:30 A.M., Central Time). At that point, trading in these contracts halts. Stock index futures are CASH SETTLED contracts. If you hold any June futures contracts through 8:30 A.M., Central Time on Friday, June 16th, they will be offset with the cash settlement price, as set by the exchange.
Monday, June 19th is Last Trading Day for June currency futures. It is of the utmost importance for currency traders to exit all June futures contracts by Friday, June 16th and to start trading the September futures. Currency futures are DELIVERABLE contracts.
The month code for September is ‘U.’ Please consider carefully how you place orders when changing over.
Trading Resource of the Week –
Trading Pattern: Rising Wedge also known as Ascending Triangle
By Joe Easton, Senior Broker
Formation:
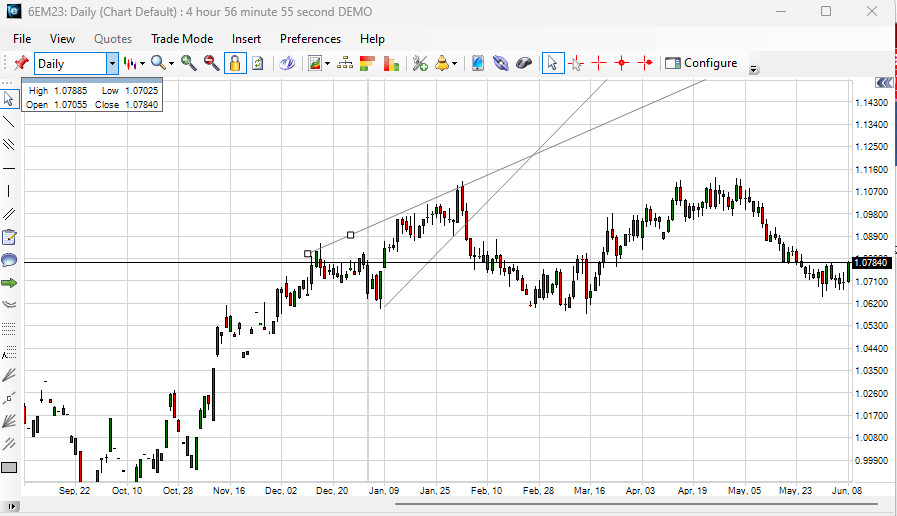
- This pattern is defined as price narrowing from a wider range to a smaller range while making higher highs and higher lows.
- This pattern is a bearish reversal signal suggesting a possible minor retracement or potential trend change.
- Typically new highs are seen on lower volume.
Try a FREE demo of the platform used to show the charts in this educational article. The platform is FREE and has charts, news, DOM, T&S, Alerts, advanced order entry, options and MUCH MORE!
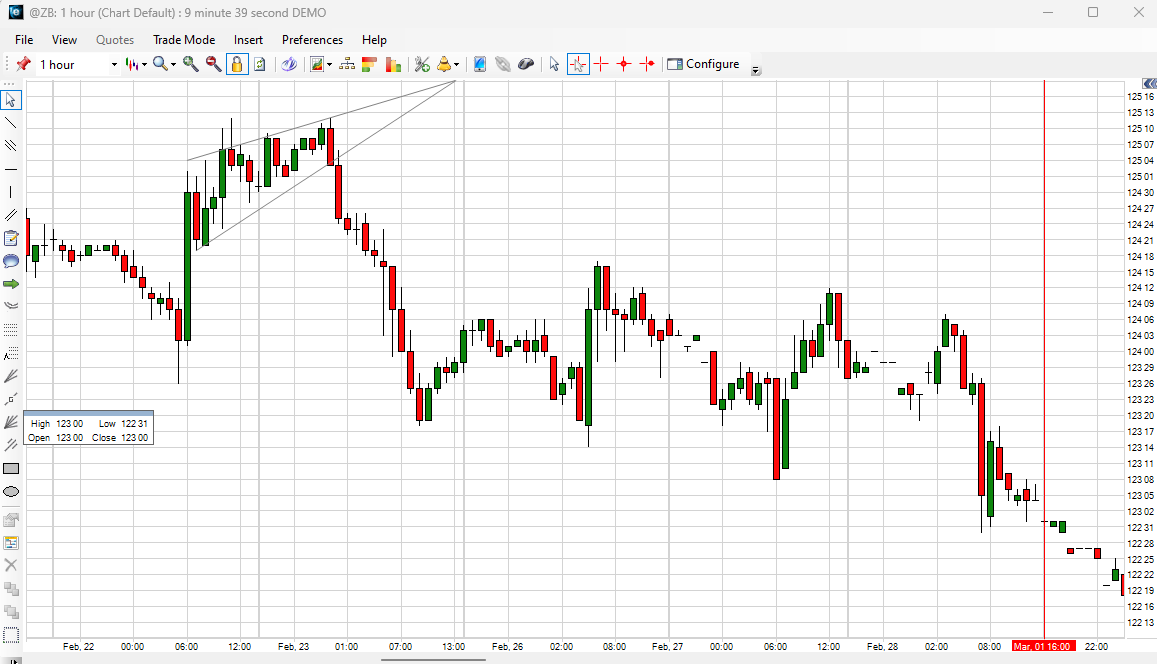
As provided in the examples above the range is narrowing toward the top of the wedge, while still making new highs. This causes a converging of trendlines to make the triangle pointing upward. Ideally this pattern breaks the lower trendline between 65-75% of completion. If the price action continues to the end of the triangle the breakout becomes less likely. Ascending triangles can also be continuation signals in a downtrend, although they have a lower probability.
How to Trade:
The ideal entry is toward the top trendline near the 60% level, this gives you a better position inside the triangle. If entered on this line your stop should be above the upper trendline.
The more conservative entry would be when the lower trendline is broken. This can happen very quickly and needs to be timed more accurately. Using the lower trendline entry the stop is placed above the lower trendline before re-entering the wedge. If the price trades back into the wedge after breaking, the pattern has less likely chance of success. Ideally when the lower trendline is broken price accelerates quickly lower.
When price breaks out you can measure the triangle at the widest section and project price to reach that same distance from the lower trendline.
Summary:
Ascending Triangles can be strong trading patterns provided the formation remains in tact. Unlike many other patterns when an ugly formation can actually be beneficial, this pattern is much more precise. Any closes above the upper trendline or below the lower trendline should continue in that direction. The price action needs to remain inside the trendlines and breakout before the end to maximize the chance of success.
Important: Trading commodity futures and options involves a substantial risk of loss.
The recommendations contained in this chart are of opinion only and do not guarantee any profits.
Past performances are not necessarily indicative of future results
A Cannon broker will be able to assist, provide feedback and answer any questions.
Hot market of the week is provided by QT Market Center, A swiss army knife charting package that’s not just for Hedgers, Cooperatives and Farmers alike but also for Spread traders, Swing traders and shorter time frame application for intraday traders with a unique proprietary indicator that can be applied to your specific trading needs.
July unleaded gasoline satisfied its first upside PriceCount Objective and appears to be entering a corrective trade, which is a normal reaction. From here, if chart can sustain further upside it would have to contend with the April highs before it can reach the second count to 2.80 .
PriceCounts – Not about where we’ve been , but where we might be going next!
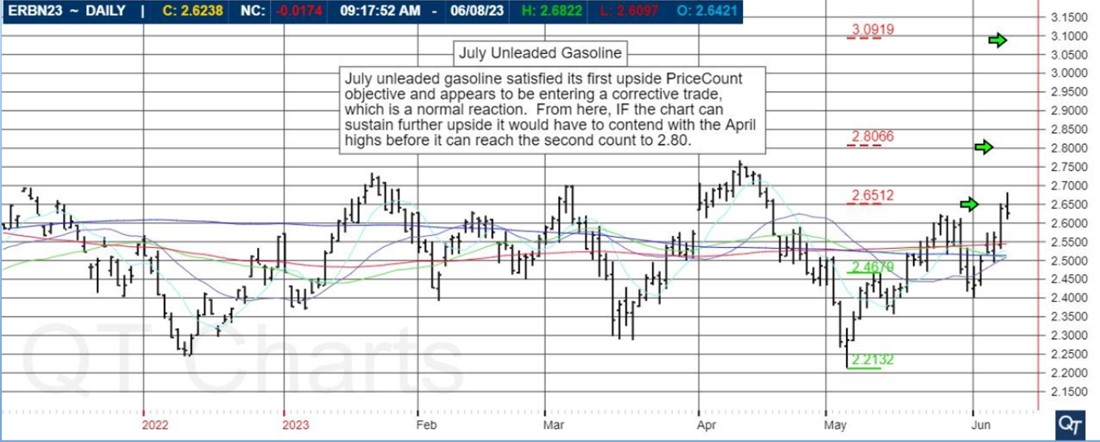
The PriceCount study is a tool that can help to project the distance of a move in price. The counts are not intended to be an ‘exact’ science but rather offer a target area for the four objectives which are based off the first leg of a move with each subsequent count having a smaller percentage of being achieved. It is normal for the chart to react by correcting or consolidating at an objective and then either resuming its move or reversing trend. Best utilized in conjunction with other technical tools, PriceCounts offer one more way to analyze charts and help to manage your positions and risk. Learn more at
www.qtchartoftheday.comTrading in futures, options, securities, derivatives or OTC products entails significant risks which must be understood prior to trading and may not be appropriate for all investors. Past performance of actual trades or strategies is not necessarily indicative of future results.

With algorithmic trading systems becoming more prevalent in portfolio diversification, the following system has been selected as the broker’s choice for this month.
PRODUCT
SYSTEM TYPE
Swing
Recommended Cannon Trading Starting Capital
$20,000
COST
USD 145 / monthly
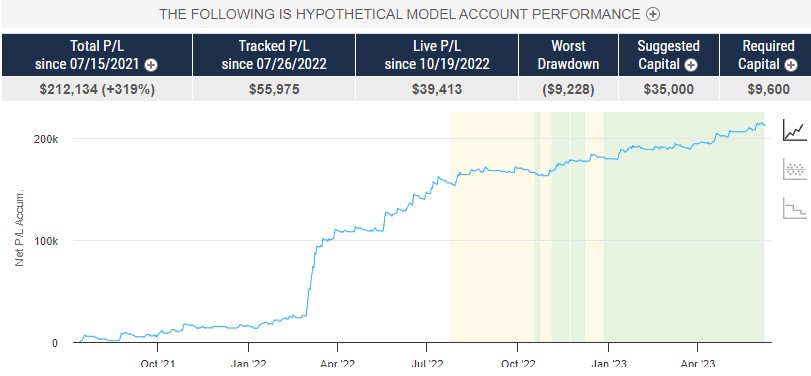
The performance shown above is hypothetical in that the chart represents returns in a model account. The model account rises or falls by the average single contract profit and loss achieved by clients trading actual money pursuant to the listed system’s trading signals on the appropriate dates (client fills), or if no actual client profit or loss available – by the hypothetical single contract profit and loss of trades generated by the system’s trading signals on that day in real time (real‐time) less slippage, or if no real time profit or loss available – by the hypothetical single contract profit and loss of trades generated by running the system logic backwards on back adjusted data.
Please read full disclaimer HERE.
Questions about the markets? trading? platforms? technology? trading systems? Get answers with a complimentary,
confidential consultation with a Cannon Trading Company series 3 broker.
-
Trading Levels for Next Week
Daily Levels for June 12th, 2022

#ES, #NQ, #YM, #RTY, #XBT, #GC, #SI, #CL, #ZB, #6E, #ZC, #ZW, #ZS, #ZM, #NG
|
Would you like to receive daily support & resistance levels?
|
Weekly Levels

#ES, #NQ, #YM, #RTY, #XBT, #GC, #SI, #CL, #ZB, #6E, #ZC, #ZW, #ZS, #ZM, #NG
-
Trading Reports for Next Week
First Notice (FN), Last trading (LT) Days for the Week: www.mrci.com
This is not a solicitation of any order to buy or sell, but a current market view provided by Cannon Trading Inc. Any statement of facts herein contained are derived from sources believed to be reliable but are not guaranteed as to accuracy, nor they purport to be complete. No responsibility is assumed with respect to any such statement or with respect to any expression of opinion herein contained. Readers are urged to exercise their own judgment in trading.
Good Trading!
Trading Futures, Options on Futures, and retail off-exchange foreign currency transactions involves substantial risk of loss and is not suitable for all investors. You should carefully consider whether trading is suitable for you in light of your circumstances, knowledge, and financial resources. You may lose all or more of your initial investment. Opinions, market data, and recommendations are subject to change at any time.
Tags: #cbot > #comex > #commoditiesmarket > #commoditiestrader > #commoditytrading > #crudeoil > #daytrader > #futuresmarket > #futurestrader > #kcbt > #mgex > #nymex > #smfe > #stockindices > #swingtrader > CME > commodities > daytrading > futures > Globex > gold
Posted in: Commodity Brokers | Day Trading | Future Trading News | Futures Trading | Indices | Weekly Newsletter


