Uncategorized Archives - Support & Resistance Levels

Uncategorized

Category Archives: Uncategorized


Futures Trading Levels and Economic Reports for July 2nd, 2013

July 1st, 2013 Filed under Uncategorized | Comments Off on Futures Trading Levels and Economic Reports for July 2nd, 2013

Connect with Us! Use Our Futures Trading Levels and Economic Reports RSS Feed.

Like us on FacebookFollow us on TwitterView our profile on LinkedInFind us on Google+Cannon Trading Futures Trading Resistance & Support Levels and Economic ReportsFind us on Yelp

1. Market Commentary
2. Futures Support and Resistance Levels – S&P, Nasdaq, Dow Jones, Russell 2000, Dollar Index
3. Commodities Support and Resistance Levels – Gold, Euro, Crude Oil, T-Bonds
4. Commodities Support and Resistance Levels – Corn, Wheat, Beans, Silver
5. Futures Economic Reports for Tuesday July 2, 2013

Hello Traders,

For 2013 I would like to wish all of you discipline and patience in your trading! 

  Read the rest of this entry »


Trading Levels and Reports for October 24, 2012

October 23rd, 2012 Filed under Future Trading News, Uncategorized | Comments Off on Trading Levels and Reports for October 24, 2012

Jump to a section in this post:

1. Market Commentary
2. Support and Resistance Levels – S&P, Nasdaq, Dow Jones, Russell 2000, Dollar Index
3. Support and Resistance Levels – Gold, Euro, Crude Oil, T-Bonds
4. Support and Resistance Levels – Corn, Wheat, Beans, Silver
5. Economic Reports for Wednesday October 24, 2012


Hello Traders,

Stock Index futures living up for their “October reputation” with a small sell off over the last few days. While the overall up trend is still in tact, I think we may see an additional pullback first.

1391 is a major support level and how the market will react if we visit this level soon, will provide futures clues.
DON’T FORGET FOMC is tomorrow as well…..

Regardless of the longer term picture ( weekly mini SP chart for your review below), as volatility increases, I recommend day-traders to DECREASE trading size in order to allow oneself a chance to stay in trades while volatility is higher.

weekly mini s&p chart


Monday Morning Support and Resistance Levels

December 5th, 2011 Filed under Uncategorized | Comment (0)

Here’s a morning cup o’ joe for all you futures traders, our morning support and resistance levels. Good trading!

Support and Resistance Levels – S&P 500, Nasdaq 100, Dow Jones, Mini Russell 2000, 30-Year US Bond, 10-Year US Note

Contract (Dec. 2011) Mini S&P 500 Mini Nasdaq 100 Dow Jones Mini Russell 2000 30-Year US Bond 10-Year US Note
Resistance Level 3

——————————————

Resistance Level 2

——————————————

Resistance Level 1

——————————————

Support Level 1

——————————————

Support Level 2

——————————————

Support Level 3

1289.25


1275.25


1262.75


1234


1218.75


1205.25

2400


2375


2345


2292.5


2265


2241

12228


12203


12178


11915


11776


11653

768.4


755.5


749.5


726.9


714.6


704.40

14219


14202


14116


14020


13924


13903

13009


12930.5


12921


12902


12820


12813.5

Support & Resistance Levels for Gold, Silver. Copper, Crude Oil, Euro Currency, Dollar Index

Contract Dec.11 Gold Dec.11 Silver Dec.11 Copper Nov.11 Crude Oil Dec.11 Euro Currency Dec.11 Dollar Index
Resistance Level 3

——————————————

Resistance Level 2

——————————————

Resistance Level 1

——————————————

Support Level 1

——————————————

Support Level 2

——————————————

Support Level 3

1753.7


1745.5


1740.9


1729


1717


1705.3

33.74


33.22


32.89


32.36


31.83


30.65

3.75


3.674


3.62


3.557


3.494


3.439

104.6


103.37


102.44


100.60


99.59


98.71

1.3726


1.3605


1.355


1.342


1.3381


1.3341

0.7915


0.7889


0.7873


0.7801


0.7795


0.7736

1224.25
1216.25
1213.25
1192.00
1185.50
1180.75
1218.75
1201.75
1199
1191.25
1183.5
1176.75

Futures Trading Levels, On Weak Markets

July 18th, 2011 Filed under Futures Trading, Uncategorized | Comment (0)

Markets are showing signs of weakness as I mentioned over past 10 days or so.

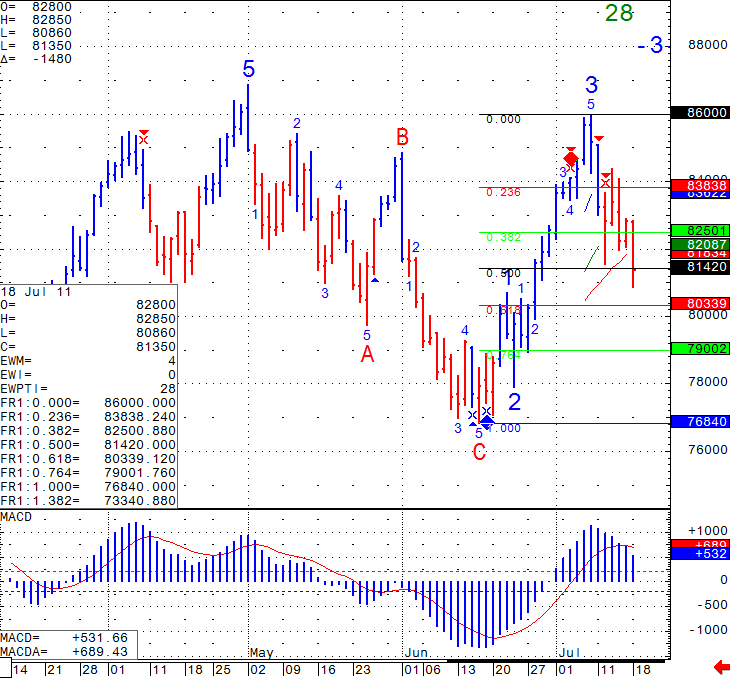
Below is a mini Russell daily chart with different levels for your review.

I think that Fridays high of 829.40 and 803.40 ( 61.8% Fibonacci level) will serve as the bands for now until we either get some acceleration of selling or exhaustion of selling and bounce.

Daily Chart of the Mini Russell from July 18th 2011

Daily Chart of the Mini Russell from July 14th 2011 Read the rest of this entry »


Futures Trading Levels, Dow Jones Update Day 3

July 13th, 2011 Filed under Uncategorized | Comment (0)

Cannon Trading / E-Futures.com

On Friday and yesterday I wrote the following below:

Friday: Looking at the Mini Dow Jones daily chart below, i will need to see a break below 12528 in order to get more confidence that the trend is starting to reverse and that odds prefer the down side.

Monday: Now that we broke this level, the next question is possible targets on the down side as well as protection on the top….Updated chart for your review below. I am looking at 126.05 as resistance above and 12374 as initial target below:

Today ( Tuesday, July 12th 2011)

With recent price action and looking at updated chart below, I would look for failed rallies against today’s high at 12516 and possible test of next target at 12267

Daily Chart of the Mini Dow Jones from July 12th 2011
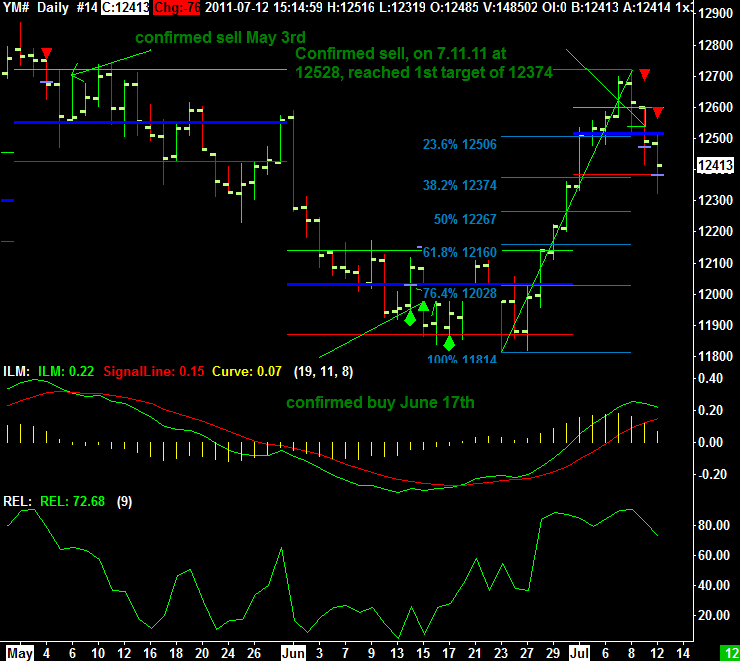
Daily Chart of the Mini Dow Jones from July 12th 2011

Would you like to have access to my DIAMOND ALGO as shown above and be able to apply for any market and any time frame? The screen shot above is of the Mini Dow from today.

If so, please send me an email with the following information:

  1. Are you currently trading futures?
  2. Charting software you use?
  3. If you use sierra or ATcharts, please let me know the user name so I can enable you.
  4. Markets you currently trading? Read the rest of this entry »
Have A Questions? Open an account Free Demo Account Free Demo Account

Question?

Valid first name is required.
Valid last name is required.
Phone number is required.
E-mail is required.
Message is required.
Phone (USA)
Phone (International)
Our Approach

You and your broker will work together to achieve your trading goals. We develop long term relationships with our clients so that we can grow and improve together.
Learn More About Choosing Cannon

Our Platforms

Please click on one of our platforms below to learn more about them, start a free demo, or open an account.
E-Futures Sierra Charts Firetip (Mac Compatible) RTrader

Trading Tips You Can Use Right Away!


Watch 4 short videos on the topics of:
  • Using Bollinger Bands and Parabolics
  • Using range Bars for Day-Trading
  • The concept of Price Confirmation
  • How to Use Support & Resistance Levels
  • License 3 Broker at your Fingertips
________
Doing Business With
See more...
Loading
Loading

Loading