New Micro Nat Gas, Crude Oil Chart + Futures Trading Levels for Nov. 9th 2023
Posted By:- Ilan Levy-Mayer Vice President, Cannon Trading Futures Blog
Updates and Bullet Points:
By Mark O’Brien, Senior Broker
General:
We have a new futures contract. It started trading on Monday. This is the Micro Henry Hub Natural Gas futures contract and corresponding options.
To quote directly from the CME Group web site, “The introduction of Micro Henry Hub Natural Gas futures and options responds directly to customer demand for a smaller, more precise instrument for managing natural gas price exposure. At one-tenth the size of the benchmark Henry Hub (NG) contract, Micro Henry Hub Natural Gas futures and options offer more granularity and smaller margin requirements with the same robust transparency and price discovery of the larger Henry Hub contracts.”
Follow the link below to the contract’s full contract specifications on the CME Group web site:
https://www.cmegroup.com/markets/energy/natural-gas/micro-henry-hub-natural-gas.contractSpecs.html
Heads up: most FCM’s / clearing firms, including the five FCM’s Cannon Trading Co. partners with, will monitor a new futures contract for sufficient liquidity before making it available to its clients. Give Cannon Trading a call to find out the availability of the contract.
Energy:
Incidentally, natural gas (basis Dec.) dropped ±50 cents (a ±$5,000 move) over the last six trading sessions to ±$3.10 /mmBtu. down to new 2-year lows on forecasts for above-normal temps. across the U.S. for the next fifteen days and continental U.S. production remaining near all-time highs,”
Financials:
Stock index futures are struggling today to extend their longest winning streak in two years – clocking seven straight daily gains – as we approach the close of trading. At this typing, the E-mini S&P 500 is trading just a few ticks either side of unchanged, while the E-mini Dow Jones and E-mini Nasdaq are slightly off.
More energy:
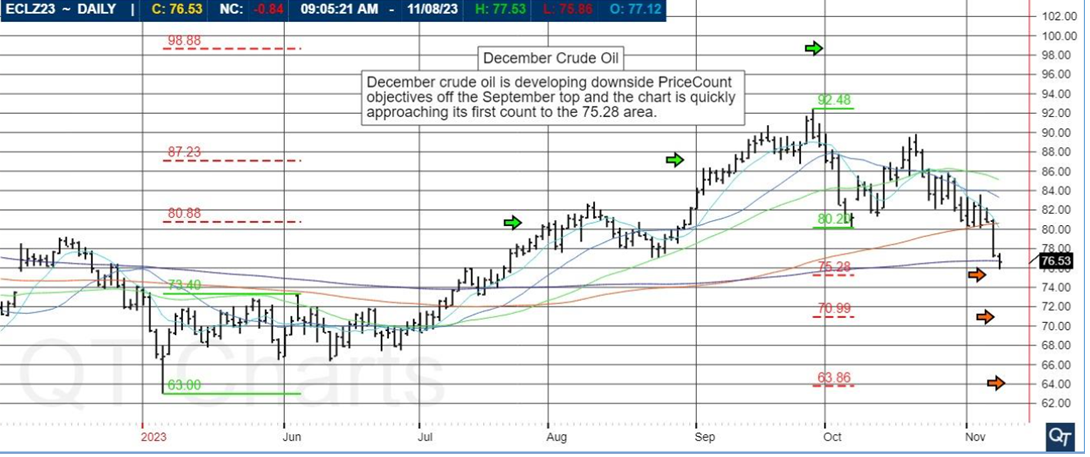
Crude oil extended its more than 2-week sell-off to its lowest level in over three months. From an intraday high of $89.85 per barrel on Oct. 20, the front month traded through $75.00 per barrel this morning – a ±$15.00 per barrel / $15,000 per contract move.
DAILY CHART BELOW
News pushing prices south include global demand worries, record U.S. production and ebbing supply concerns surrounding the Gaza conflict.
Given its ability to create a ripple effect, the ±15% price decline dragged U.S. pump prices down to levels not seen since March. It has also helped rein in inflation expectations and worrisome bond yields.
While this paints a picture that fears are subsiding that a wider conflict could be emerging in the Middle East and disrupt supplies, traders should remain on high alert for signs to the contrary.
Plan your trade and trade your plan.

Trading Futures, Options on Futures, and retail off-exchange foreign currency transactions involves substantial risk of loss and is not suitable for all investors. You should carefully consider whether trading is suitable for you in light of your circumstances, knowledge, and financial resources. You may lose all or more of your initial investment. Opinions, market data, and recommendations are subject to change at any time when it comes to Futures Trading.
Futures Trading Levels
11-09-2023

#ES, #NQ, #YM, #RTY, #XBT, #GC, #SI, #CL, #ZB, #6E, #ZC, #ZW, #ZS, #ZM, #NG
Improve Your Trading Skills
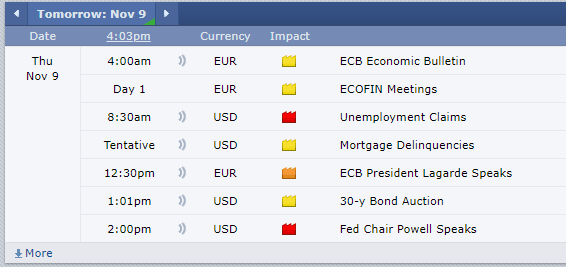
Economic Reports, Source:

This is not a solicitation of any order to buy or sell, but a current market view provided by Cannon Trading Inc. Any statement of facts here in contained are derived from sources believed to be reliable, but are not guaranteed as to accuracy, nor they purport to be complete. No responsibility is assumed with respect to any such statement or with respect to any expression of opinion herein contained. Readers are urged to exercise their own judgement in trading.


