
Dear Futures Trader,
- Learn to reduce trading size. Perhaps trade smaller contracts like the micros.
- Adjust stops and entries based on volatility ( ATR/ Parabolics).
- Be extra picky on entries without chasing trades.
- Understand that loses are part of trading and this is definitely not a good time to “fight the markets”.
- Focus more on risk management and ways to protect certain positions as needed. Survive to trade another day.
- Consider possibly utilizing short term options rather than futures.

Good Trading
Trading Futures, Options on Futures, and retail off-exchange foreign currency transactions involves substantial risk of loss and is not suitable for all investors. You should carefully consider whether trading is suitable for you in light of your circumstances, knowledge, and financial resources. You may lose all or more of your initial investment. Opinions, market data, and recommendations are subject to change at any time when it comes to Futures Trading.
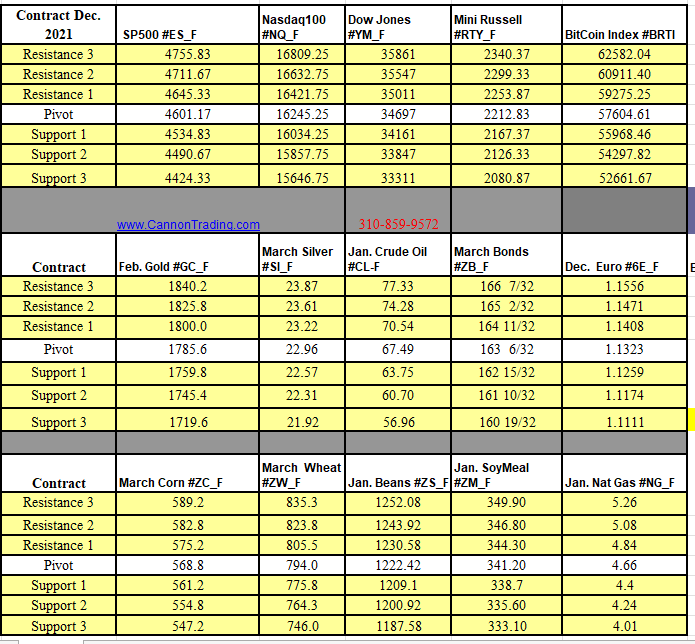
Futures Trading Levels
12-01-2021
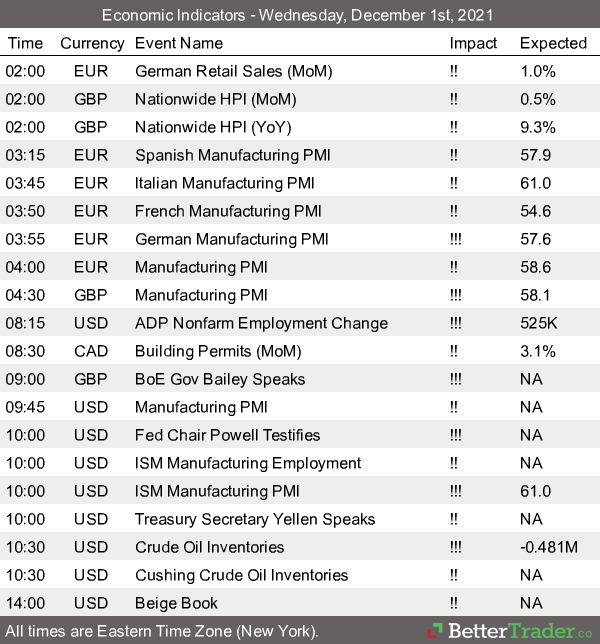
Economic Reports, source:
This is not a solicitation of any order to buy or sell, but a current market view provided by Cannon Trading Inc. Any statement of facts here in contained are derived from sources believed to be reliable, but are not guaranteed as to accuracy, nor they purport to be complete. No responsibility is assumed with respect to any such statement or with respect to any expression of opinion herein contained. Readers are urged to exercise their own judgement in trading.


