Daily Support & Resistance Levels

This blog provides daily support and resistance levels for major commodities, indices, and financial futures contracts, along with market outlooks and insights.

October 29, 2026
Future Trading News

Your Important Soybean Futures Trading Outlook | October 30th, 2026

9dc1e02e d5f7 4ff4 abf7 1df60775f196

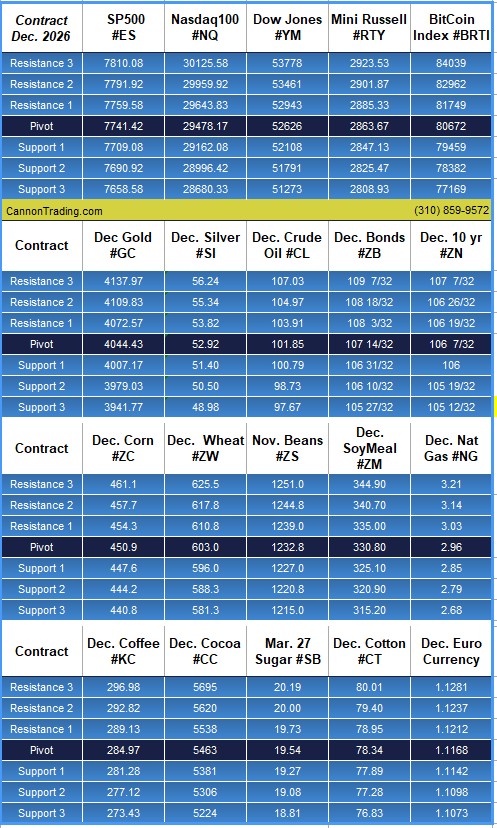
At A Glance Levels

Instrument S2 S1 Pivot R1 R2

Gold (GC)

— Dec. (#GC)

3979.03 4007.17 4044.43 4072.57 4109.83

Silver (SI)

— Dec. (#SI)58.79

50.50 51.92 52.92 53.82 55.34

Crude Oil (CL)

— Dec. (#CL)

98.73 100.79 101.85 103.91 104.97

 Dec. Bonds (ZB)

— Dec. (#ZB)

106 10/32 106 31/32 107 14/32 108 3/32 108 18/32

Trading Relative Strength Instead of Direction

Spread Trading amidst Tech Selloffs

Today’s technology-led selloff is a good example of why some traders prefer index spread trading. As concerns grew over AI spending and disappointing tech earnings, the Nasdaq significantly underperformed the broader market, causing NQ/MNQ to weaken relative to the Dow and other indexes.

Instead of simply being long or short the market, a trader could express a view on relative performance. For example, a Short MNQ vs. Long 2 MYM spread would have benefited from today’s rotation out of technology and into more traditional blue-chip stocks. Likewise, traders using Long ES vs. Short RTY or the reverse can capitalize ( or risk…) on shifts in market leadership rather than overall market direction.

In the current environment, investors appear increasingly focused on profitability, valuations, and where institutional money is flowing. That creates opportunities for spread traders who seek to identify the market’s winners and losers, rather than simply predicting whether the next move will be up or down.

Bottom line: Today’s Nasdaq weakness highlights how intraday futures spreads may allow traders to capitalize on changing market sentiment and sector rotation while potentially reducing outright market exposure – that being said , spreads are just as risky as outright futures and the above is meant as “food for thought”.

Important: Trading commodity futures and options involves a substantial risk of loss.

The recommendations contained in this chart are of opinion only and do not guarantee any profits.

Past performances are not necessarily indicative of future results.

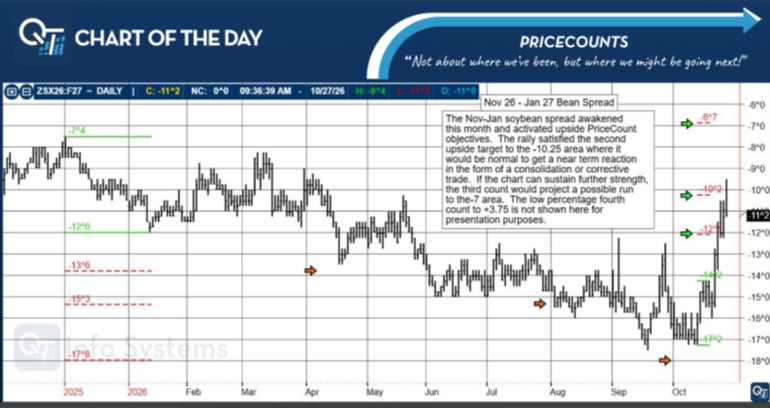
Nov 26 – Jan 27 Bean Spread

The Nov-Jan soybean spread awakened this month and activated upside PriceCount objectives. The rally satisfied the second upside target to the -10.25 area where it would be normal to get a near term reaction in the form of a consolidation or corrective trade. If the chart can sustain further strength, the third count would project a possible run to the -7 area. The low percentage fourth count to the +3.75 is not shown here for presentation purposes.

trading

The PriceCount study is a tool that can help to project the distance of a move in price. The counts are not intended to be an ‘exact’ science but rather offer a target area for the four objectives which are based off the first leg of a move with each subsequent count having a smaller percentage of being achieved.

It is normal for the chart to react by correcting or consolidating at an objective and then either resuming its move or reversing trend. Best utilized in conjunction with other technical tools, PriceCounts offer one more way to analyze charts and help to manage your positions and risk.

Learn more at https://www.qtinfo.com/analysis/qt-chart-of-the-day/

Trading in futures, options, securities, derivatives or OTC products entails significant risks which must be understood prior to trading and may not be appropriate for all investors. Past performance of actual trades or strategies is not necessarily indicative of future results.

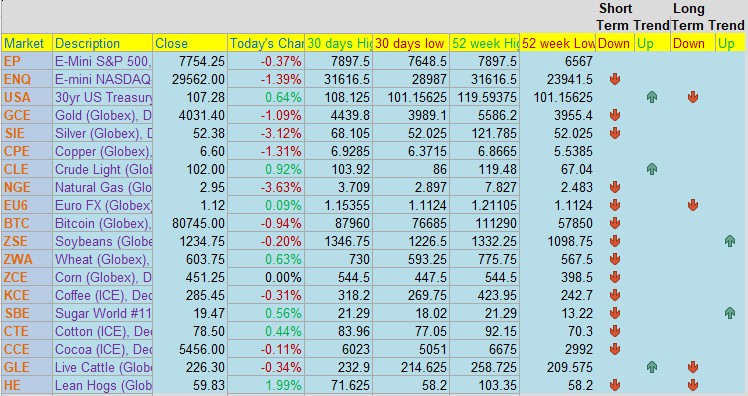
Cannon Edge — Your Daily Futures Snapshot for Oct. 30th

a91c4138 e041 45d1 8b56 2a73bf30f9b9

Cannon Edge is our new daily feature designed to give traders a fast, actionable overview of key futures markets. Each post delivers:

·    Current price and daily % change

·    30‑day and 52‑week highs/lows

·    PROPRIETARY Short‑term and long‑term trend signals

·    Coverage across equity indices, metals, energies, currencies, and ags

Whether you’re scanning for breakout setups, trend reversals, or just staying informed — Cannon Edge puts the data in your hands before the open.

Built for speed. Backed by insight. Powered by CQG.

Daily Levels for October 30th, 2026

27275627 8f7a 418c 80cf e8db079e79a0

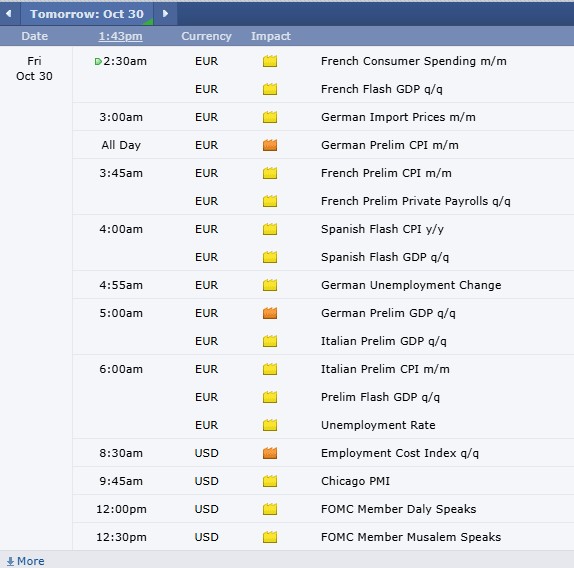
Economic Reports

provided by: ForexFactory.com

All times are Central Time ( Chicago)

f3c37ced 104e 4b0f bfaf 7819681b8719

Find us on Trustpilot

41a3c910 28d6 4126 946b 6659bb02ae4d

Trading Futures, Options on Futures, and retail off-exchange foreign currency transactions involves substantial risk of loss and is not suitable for all investors. You should carefully consider whether trading is suitable for you in light of your circumstances, knowledge, and financial resources. You may lose all or more of your initial investment. Opinions, market data, and recommendations are subject to change at any time.

Join our Private Facebook group

Subscribe to our YouTube Channel

Listen to our podcast: Subscribe on Apple, Spotify, Amazon

or wherever you listen to podcasts!

S
Facebook  Instagram  LinkedIn
S
ef3ab1c9 8d6d 4e60 a3f1 af5d9d4ecbb3

Services

Software

Tools

Community

Contact

By Cannon Operations « Back to All Posts