Support & Resistance Levels

This Blog provides futures market outlook for different commodities and futures trading markets, mostly stock index futures, as well as support and resistance levels for Crude Oil futures, Gold futures, Euro currency and others. At times the daily trading blog will include educational information about different aspects of commodity and futures trading.

Monday Morning Support and Resistance Numbers

Here’s a morning cup o’ joe for all you futures traders, our morning support and resistance levels. Good trading!

(If you would like these numbers emailed to you before the S&P open, sign up and have them emailed.

Cannon respects your privacy and will not share your information with anybody else for any reason.)

divider black 190

Support and Resistance Levels – S&P 500, Nasdaq 100, Dow Jones, Mini Russell 2000, 30-Year US Bond, 10-Year US Note

Contract (Dec. 2011) Mini S&P 500 Mini Nasdaq 100 Dow Jones Mini Russell 2000 30-Year US Bond 10-Year US Note
Resistance Level 3——————————————

Resistance Level 2

——————————————

Resistance Level 1

——————————————

Support Level 1

——————————————

Support Level 2

——————————————

Support Level 3

1318.5

1311.5


1307.5


1303


1294.75


1286.5

2461

2451


2445


2433


2409


2390

12679

12614


12577


12502


12435


12219

808.80

801.70


798.7


781.9


773.2


765.5

14611

14513


14426


14325


14307


13208

13228.5

13216.5


13205.5 (all time high)

13118.5


13109


13100

Continue reading “Monday Morning Support and Resistance Numbers”

FRIDAY Morning Support and Resistance Levels

Here’s a morning cup o’ joe for all you futures traders, our morning support and resistance levels. Good trading!

divider black 190

Support and Resistance Levels – S&P 500, Nasdaq 100, Dow Jones, Mini Russell 2000, 30-Year US Bond, 10-Year US Note

Contract (Dec. 2011) Mini S&P 500 Mini Nasdaq 100 Dow Jones Mini Russell 2000 30-Year US Bond 10-Year US Note
Resistance Level 3——————————————

Resistance Level 2

——————————————

Resistance Level 1

——————————————

Support Level 1

——————————————

Support Level 2

——————————————

Support Level 3

1293.75

1301.75


1310.5


1328.25


1347.75


1354.5

2385

2405


2428


2469


2478.5


2490

12493

12558


12631


12768


12804


12873

765.5

773.2


781.9


798.3


801.70


808.80

13920

14025


14123


14219


14226


14319

13013

13025


13031.5


13112.5


13117.5


13123.5

Continue reading “FRIDAY Morning Support and Resistance Levels”

Few pointers for you day-traders out there | Support and Resistance Levels

Jump to a section in this post:
1. Market Commentary
2. Support and Resistance Levels – S&P, Nasdaq, Dow Jones, Russell 2000
3. Support and Resistance Levels – Gold, Euro, Crude Oil, T-Bonds
4. Support and Resistance Levels – March Corn, March Wheat, Jan Beans, March Silver
5.Economic Report for January 27, 2012

1. Market Commentary

Few pointers for you day-traders out there. I am sure you have heard some from different resources but never hurts to read and absorb this again:

1. Be patient
2. Limit the number of hours you trade
3. Know your DAILY risk before the day begins and this will dictate
the number of contracts you trade
4. Choose markets with high liquidity
5. Know what reports come out every day and their impact on the markets.
6. Understand that even the best methods will have losing days.
7. Learn to accept loses
8. use RISK CAPITAL only
9. Don’t try to trade and do other things….
10. Educate yourself
11. Keep a trading journal

More to come in a webinar over the next few weeks. Will keep you posted.

2. Support and Resistance Levels – S&P, Nasdaq, Dow Jones, Russell 2000

Contract (Dec. 2011) SP500
(big & Mini)
Nasdaq100
(big & Mini)
Dow Jones
(big & Mini)
Mini Russell
Resistance Level 3 1346.17 2510.67 12895 809.77
Resistance Level 2 1337.83 2494.33 12837 804.23
Resistance Level 1 1326.17 2474.17 12759 798.17
Pivot Point 1317.83 2457.83 12701 792.63
Support Level 1 1306.17 2437.67 12623 786.57
Support Level 2 1297.83 2421.33 12565 781.03
Support Level 3 1286.17 2401.17 12487 774.97

Continue reading “Few pointers for you day-traders out there | Support and Resistance Levels”

Thursday Morning Support and Resistance Numbers

Here’s a morning cup o’ joe for all you futures traders, our morning support and resistance levels. Good trading!

divider black 190

Support and Resistance Levels – S&P 500, Nasdaq 100, Dow Jones, Mini Russell 2000, 30-Year US Bond, 10-Year US Note

Contract (Dec. 2011) Mini S&P 500 Mini Nasdaq 100 Dow Jones Mini Russell 2000 30-Year US Bond 10-Year US Note
Resistance Level 3——————————————

Resistance Level 2

——————————————

Resistance Level 1

——————————————

Support Level 1

——————————————

Support Level 2

——————————————

Support Level 3

1354.5 

1347.75


1328.25


1310.5


1301.75


1293.75

2490 

2478.5


2469


2428


2405


2385

12873 

12804


12768


12631


12558


12493

808.80 

801.70


798.3


781.9


773.2


765.5

14319 

14226


14219


14123


14025


13920

13123.5 

13117.5


13112.5


13031.5


13025


13013

Continue reading “Thursday Morning Support and Resistance Numbers”

E-Mini S&P 500 – Support and Resistance Levels

Jump to a section in this post:
1. Market Commentary
2. Support and Resistance Levels – S&P, Nasdaq, Dow Jones, Russell 2000
3. Support and Resistance Levels – Gold, Euro, Crude Oil, T-Bonds
4. Support and Resistance Levels – March Corn, March Wheat, Jan Beans, March Silver
5.Economic Report for January 26, 2012

1. Market Commentary

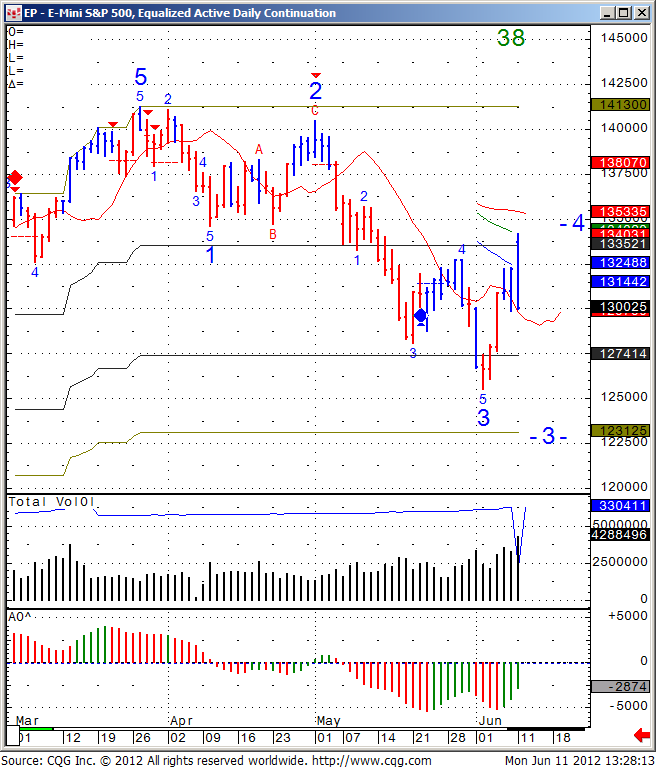
FOMC is behind us and below you will find some commentary from WSJ online as well as my daily chart of the Mini SP 500, which like always have at least two scenarios…upside possible targets as well as reversal zones if the market losses momentum..While I think this market may be overbought, I would not look to fight this momentum unless I see signs of buying exhaustion and reversal.
************************************************************
WSJ BLOG/MarketBeat: Today Looks a Lot Like a QE Trade
01/25/12 14:32

(This story has been posted on The Wall Street Journal Online’s Market Beat blog at http://blogs.wsj.com/marketbeat.)

By Min Zeng
US stocks and gold are bouncing, the ten-year Treasury yield is tumbling below 2% again (at least briefly) and the dollar is getting hit — sounds like the typical picture of a QE trade rippling through the financial markets.
Indeed, some market participants are taking today’s dovish FOMC statement as QE-lite.
The key boost for risky assets lies in the Fed’s further extension of its promise to keep its ultra-low target rate into late 2014. That means investors can be assured that the first rate hike won’t come until then or even later.
A bond trader says that the statement signals the Fed is more worried about deflation, which suggests more policy easing to co! me.
“They won’t use the D word but that is what they are thinking,” he says. “Expect QE3 to come.”
The dollar wilts on the dovish Fed, with the euro up 0.4% at $1.309.
Gold, another QE beneficiary, bounced from less than $1660 an ounce before the Fed’s statement to more than $1710 at last check.

EP - E- mini S&P 500, Equalized Active Daily Continuation
EP – E- mini S&P 500, Equalized Active Daily Continuation

Continue reading “E-Mini S&P 500 – Support and Resistance Levels”

60 Minutes mini SP Chart – Support and Resistance Levels

Jump to a section in this post:
1. Market Commentary
2. Support and Resistance Levels – S&P, Nasdaq, Dow Jones, Russell 2000
3. Support and Resistance Levels – Gold, Euro, Crude Oil, T-Bonds
4. Support and Resistance Levels – March Corn, March Wheat, Jan Beans, March Silver
5.Economic Report for January 25, 2012

1. Market Commentary

A day full of reports ahead of us tomorrow along with State of the Union tonight.

Be ready for the unexpected.

FOMC meeting tomorrow. Statement will be released around 2:15 PM EST

FOMC days have different characteristics than other trading days. If you have traded for a while, check your trading notes from past FOMC days that may help you prepare for tomorrow.

If you are a newcomer, take a more conservative approach and make sure you understand that the news can really move the market.

My observations suggest choppy, low volume up until announcement, followed by some some sharp volatile moves right during and after the announcement. However, with tomorrow early morning reports and recent volatility, we may see wild action through out.

One advice everyone can benefit from is, reduce your trading size in proportion to the increase in volatility. This should help your comfort level while in the day-trade.

Below is a another tip from using our ATcharts ( ATcharts comes free for our live TransactAt clients who trade 10 round turns and more per month and is
available for a free demo )

In today’s “tip” I want to share how I like to look at different type of charts sometimes when it comes to day trading, below you will see how I change my 60 minutes chart into 8 ticks range bar chart:

1. As you can see below I right click in the middle of the chart
which is a 60 minute chart of the mini SP
2. I than choose chart settings and select
range in ticks ( true ) under the bar period.
3. From the same menu one can also change the graph style from OHLC to candlesticks and much more under Graph Type on the bottom left corner.

Continue reading “60 Minutes mini SP Chart – Support and Resistance Levels”

Chart of The Dow Jones Cash Index

Jump to a section in this post:
1. Market Commentary
2. Support and Resistance Levels – S&P, Nasdaq, Dow Jones, Russell 2000
3. Support and Resistance Levels – Gold, Euro, Crude Oil, T-Bonds
4. Support and Resistance Levels – March Corn, March Wheat, Jan Beans, March Silver
5.Economic Report for January 24, 2012

1. Market Commentary

A week full of reports ahead with the “star” coming out this Wednesday, that being FOMC.

In between, you can view a chart of the Dow Jones Industrial chart with a possible small sell signal if the Dow Cash breaks below 12648.

Some of you may ask why am I showing the chart of the Dow Jones Cash Index? And my answer is that when it comes to stock indices, “Cash is King” and in this case the underlying asset for the Dow Jones futures ( and mini Dow Jones) is the Dow Jones Index, just like the SP500 cash index is the underlying for the mini SP500 futures.


Dow Jones Cash Index Chart

Continue reading “Chart of The Dow Jones Cash Index”

Tuesday Morning Support and Resistance Numbers

Here’s a morning cup o’ joe for all you futures traders, our morning support and resistance levels. Good trading!

divider black 190

Support and Resistance Levels – S&P 500, Nasdaq 100, Dow Jones, Mini Russell 2000, 30-Year US Bond, 10-Year US Note

Contract (Dec. 2011) Mini S&P 500 Mini Nasdaq 100 Dow Jones Mini Russell 2000 30-Year US Bond 10-Year US Note
Resistance Level 3 —————————————— Resistance Level 2——————————————

Resistance Level 1

——————————————

Support Level 1

——————————————

Support Level 2

——————————————

Support Level 3

1318.251312.25


1308.5


1296


1289


1282.25

24902452.5


2436


2414.75


2395


2377

1287312749


12709


12586


12521


12464

808.80790


787.9


774.1


766.8


760.3

1431914215


14127


14025


13927


13920

1302513017.5


1309.5


12928.5


12926


12921

Continue reading “Tuesday Morning Support and Resistance Numbers”

Monday Morning Support and Resistance

Here’s a morning cup o’ joe for all you futures traders, our morning support and resistance levels. Good trading!

divider black 190

Support and Resistance Levels – S&P 500, Nasdaq 100, Dow Jones, Mini Russell 2000, 30-Year US Bond, 10-Year US Note

Contract (Dec. 2011) Mini S&P 500 Mini Nasdaq 100 Dow Jones Mini Russell 2000 30-Year US Bond 10-Year US Note
Resistance Level 3——————————————

Resistance Level 2

——————————————

Resistance Level 1

——————————————

Support Level 1

——————————————

Support Level 2

——————————————

Support Level 3

1328.5 

1321.25


1313


1300.5


1293.25


1287

2490 

2442.5


2436


2407.5


2389


2372.5

12873 

12749


12692


12573


12113


12455

808.80 

790


784.9


771.8


764.9


758.8

14307 

14222


14204


14025


13927


13920

13101 

13019


13011.5


12928.5


12925


12921

Continue reading “Monday Morning Support and Resistance”

Weekly Newsletter and Support and Resistance Levels

Jump to a section in this post:
1. Market Commentary
2. Support and Resistance Levels – S&P, Nasdaq, Dow Jones, Russell 2000
3. Support and Resistance Levels – Gold, Euro, Crude Oil, T-Bonds
4. Support and Resistance Levels – March Corn, March Wheat, Jan Beans, March Silver
5.Economic Report for January 23, 2012

1. Market Commentary

Wishing all of you a great weekend and a good trading week to come.

Weekly newsletter for your review here:

https://www.cannontrading.com/news/price-map-march-british-pound-stock-market-not-physics

2. Support and Resistance Levels – S&P, Nasdaq, Dow Jones, Russell 2000

<

Contract (Dec. 2011) SP500
(big & Mini)
Nasdaq100
(big & Mini)
Dow Jones
(big & Mini)
Mini Russell
Resistance Level 3 1320.23 2449.83 12792 792.63
Resistance Level 2 1315.87 2443.17 12728 788.57
Resistance Level 1 1313.43 2439.33 12697 785.03
Pivot Point 1309.07 2432.67 12633 780.97
Support Level 1 1306.63 2428.83 12602 777.43
Support Level 2 1302.27 2422.17 12538 773.37
Support Level 3 1299.83 2418.33 12507 769.83

Continue reading “Weekly Newsletter and Support and Resistance Levels”