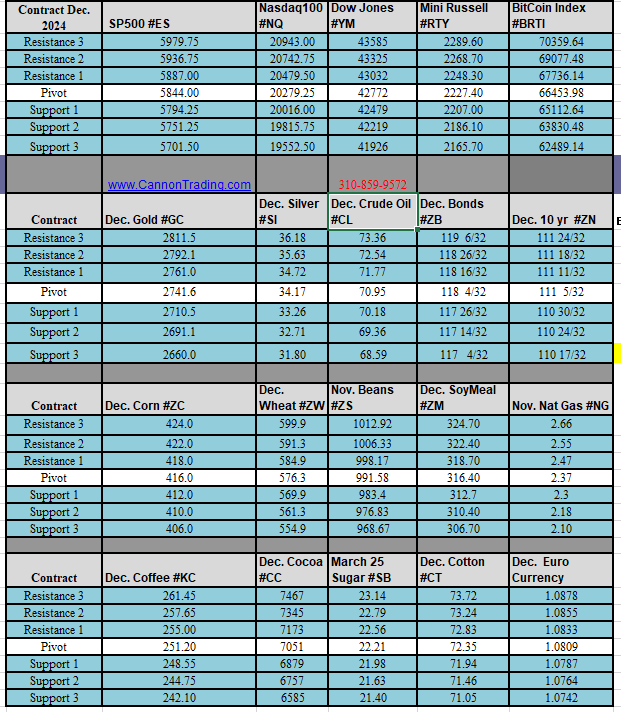
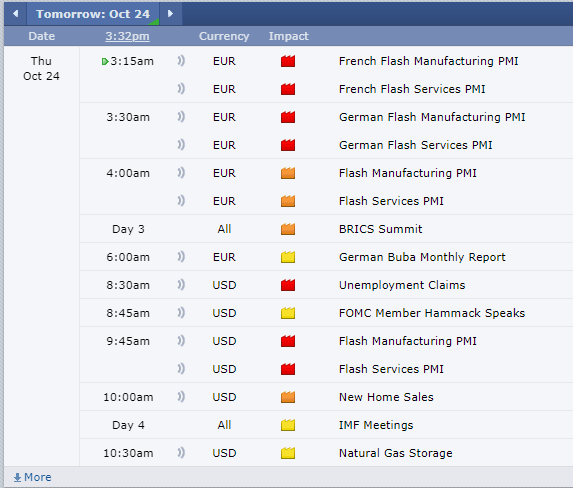
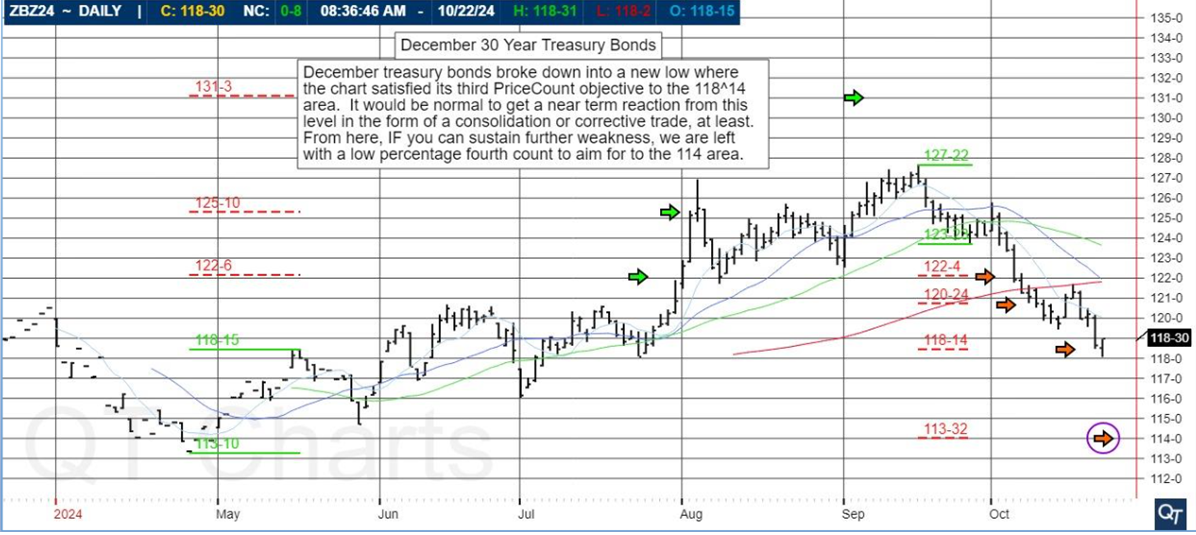
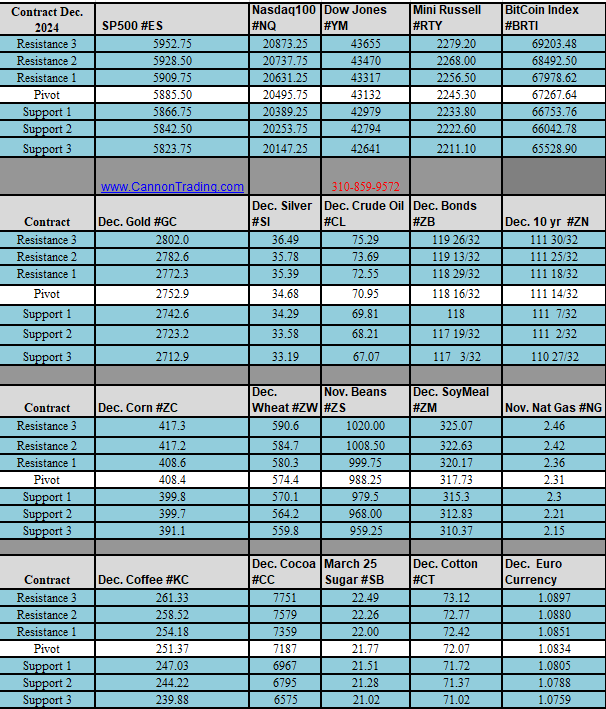
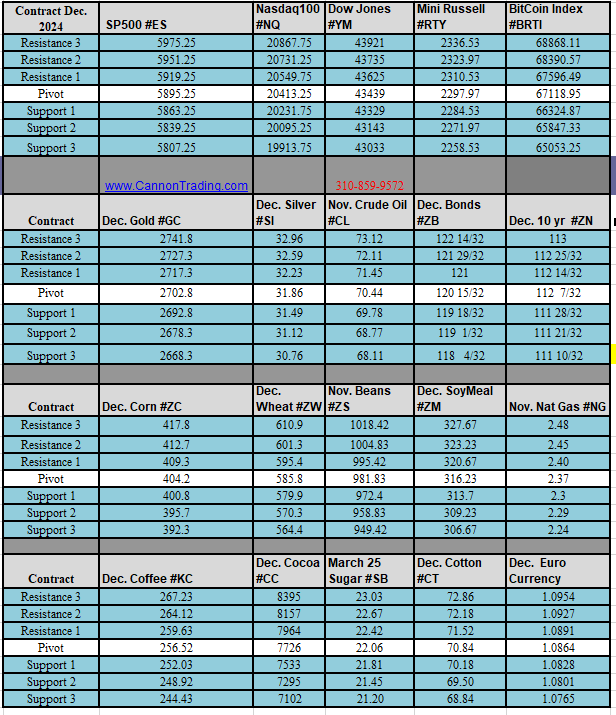
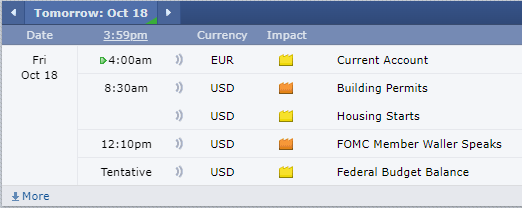
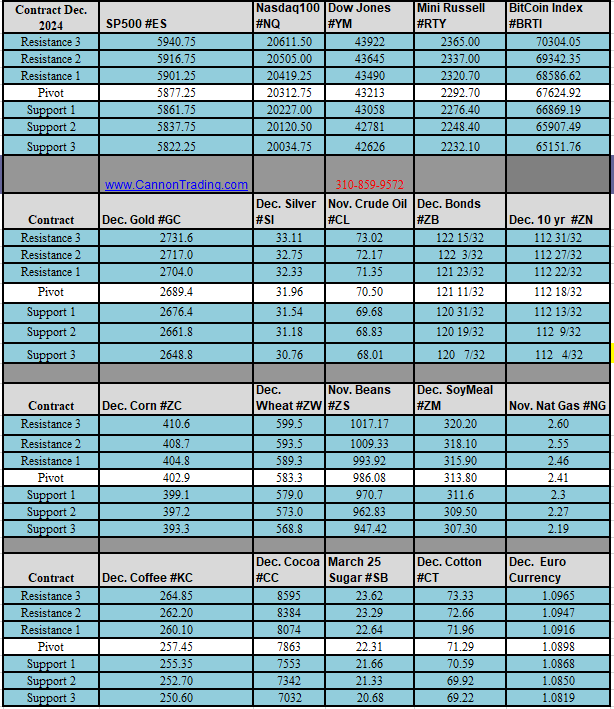
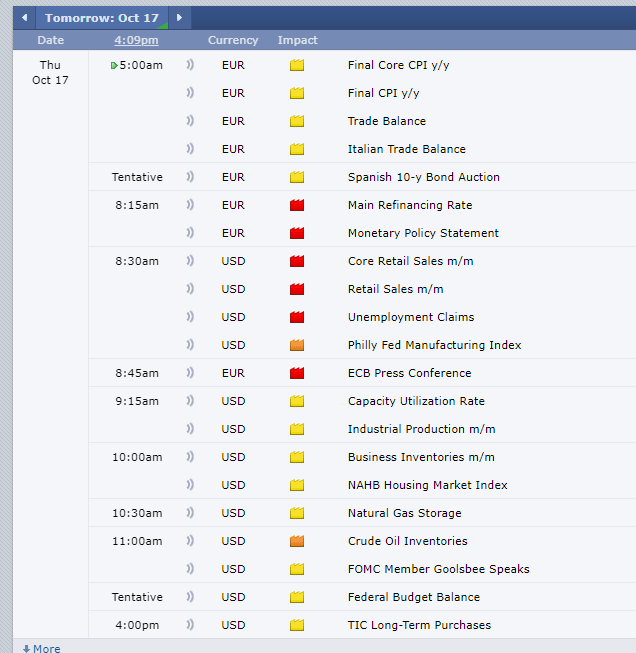
Support & Resistance Levels

This Blog provides futures market outlook for different commodities and futures trading markets, mostly stock index futures, as well as support and resistance levels for Crude Oil futures, Gold futures, Euro currency and others. At times the daily trading blog will include educational information about different aspects of commodity and futures trading.
Coffee, Hope, Probability + Levels for May 7th

Get Real Time updates and more by joining our Private Facebook Group!
Subscribe to our YouTube Channel
Listen to our Market Recap Podcasts on Apple Podcasts


C50


Coffee, Hope & Probability….


by John Thorpe, Senior Broker

In lieu of a light Data and fed speaker wee, we have a relatively heavy earnings week but none of the magnificent seven reporting, so here goes with a few words on the Coffee Futures Market.


After the July coffee market rallied to contract highs April 16th.. @245.50

A target based on price count theory had been met and there was a low probability of the rally extending much higher.

When we got the corrective trade and price action took us down below the 21 day MA at the 220.00 area, , this market , for us, showed the rally was over for the time being.

It certainly looks like the price action wants to get back down into the channel between 198.00 and 175.00 as it was uncomfortable at the higher price levels above 200  , due to the steep sell off from the mid-April highs I would look for a corrective rally before we continue back into the comfort zone.

Seasonality:  Southern Hemisphere coffees have already been harvested; Northern hemisphere coffee beans be ripe for the picking in Early Summer to Mid Fall.

The crop was better than expected in the southern hemisphere and the Northern hemisphere weather is tempering…  unless there becomes a disease scare or a sudden drought the next few months, I would anticipate Coffee Bean prices to moderate further, working lower and testing the bottom of the range.


Above we Referenced “probability

The difference between probability and hope

Is that probability is the state of being probable; likelihood.. While hope is the belief or expectation that something wished for can or will happen.

Probability is usually stated between 0 and 1 , One reflecting the highest probability of an event occurring and zero meaning no chance the event will occur.

We avoid Hope in our trading decisions.


143bd441 8c34 4b4b 82e2 a7b7f304f6ca


6c4e27c5 2f1e 4083 b574 381118d176a0

stars

e35cb555 9ff3 4f00 9fe8 0655b28fbd90

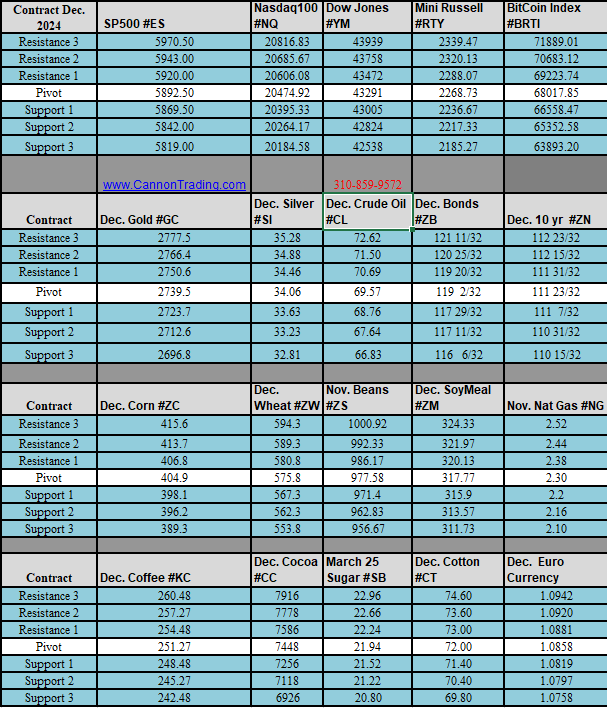
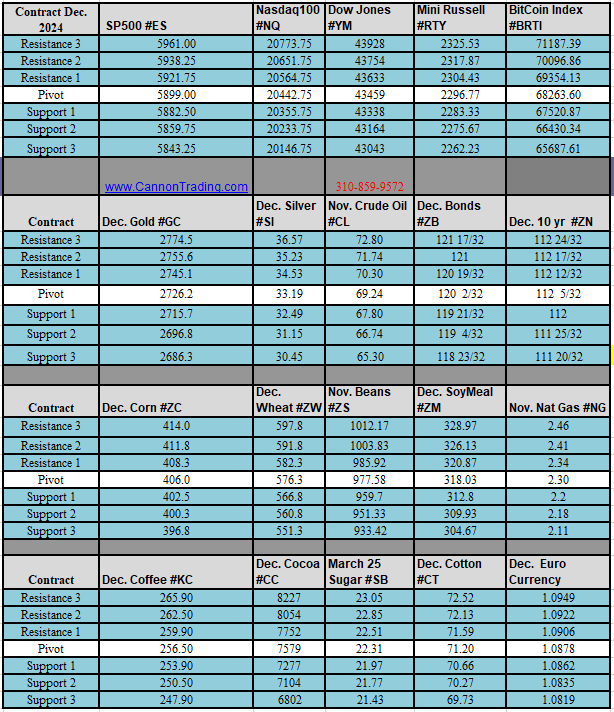
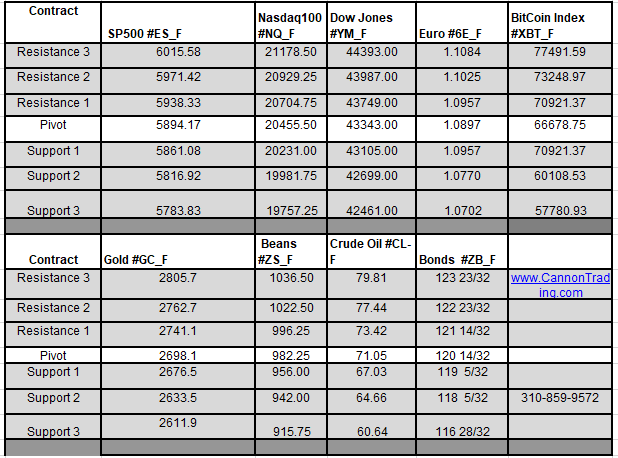
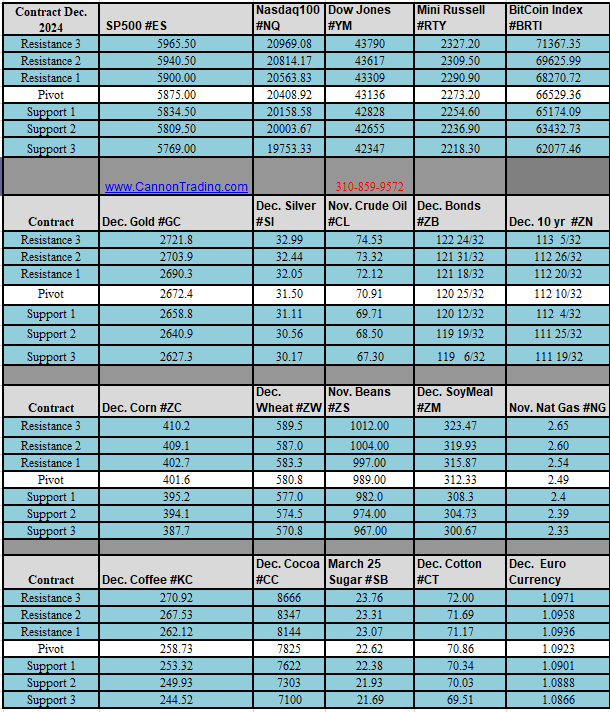
Daily Levels for May 6th, 2024

23464963 1884 44bf bf7c 6877e6c05a70

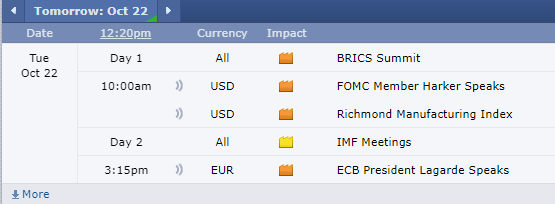
Economic Reports
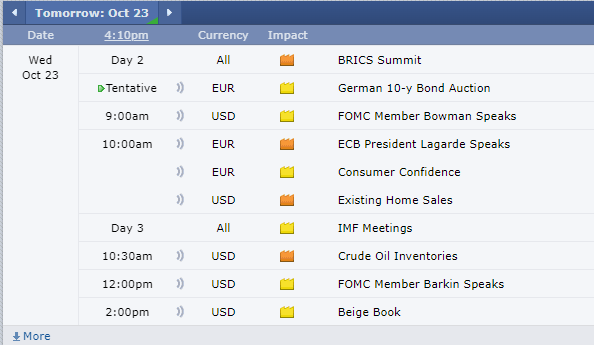
provided by: ForexFactory.com
All times are Eastern Time ( New York)
90df354a 0440 4981 9c20 41532e3a22a7

Improve Your Trading Skills
Get access to proprietary indicators and trading methods, consult with an experienced broker at 1-800-454-9572.

Explore trading methods. Register Here

3b644da2 2bee 4d39 8d98 5208a20bec39

* This is not a solicitation of any order to buy or sell, but a current market view provided by Cannon Trading Inc. Any statement of facts here in contained are derived from sources believed to be reliable, but are not guaranteed as to accuracy, nor they purport to be complete. No responsibility is assumed with respect to any such statement or with respect to any expression of opinion herein contained. Readers are urged to exercise their own judgement in trading.

Soymeal Outlook & Futures Trading Levels | Cannon Trading

Get Real Time updates and more by joining our Private Facebook Group!
Subscribe to our YouTube Channel

C33

Cannon Futures Weekly Letter Issue # 1192

In this issue:
  • Important Notices – First Notice & Last Trading Days
  • Futures 101 – Hedging Guide
  • Hot Market of the Week – July Soymeal
  • Broker’s Trading System of the Week – ES Swing System
  • Trading Levels for Next Week
  • Trading Reports for Next Week


Important Notices – Next Week Highlights:

  • Fed Governors to speak: Cook on Financial Stability Wed. Afternoon – Bowman on Financial Stability Risks Fri. Morning
  • A Very Light Data Week, Jobless claims Thursday Pre Market
  • Additional Agricultural Market Volatility on the horizon: USDA Crop Production and Supply/Demand Estimates Fri. 11am Central
  • Earnings next week include Disney, Uber and Air BNB as the largest cap stocks featured.

a302b9ea dc0d 4274 afb6 62624b2690b1

ba48cab1 37a2 42fe a4ce a080939efa85


Futures 101 : Futures Hedging Self Study Guide!

Self-Study Guide to Hedging with Grain and Oilseed Futures and Options. Regardless if you are a farmer, rancher or simply looking to trade grains and livestock futures, this guide will help you understand the ins and outs of trading and hedging using futures and options.


stars

3b644da2 2bee 4d39 8d98 5208a20bec39


  • Hot Market of the Week – July Soymeal
Hot market of the week is provided by QT Market Center, A Swiss army knife charting package that’s not just for Hedgers, Cooperatives and Farmers alike but also for Spread traders, Swing traders and shorter time frame application for intraday traders with a unique proprietary indicator that can be applied to your specific trading needs.
July Soymeal
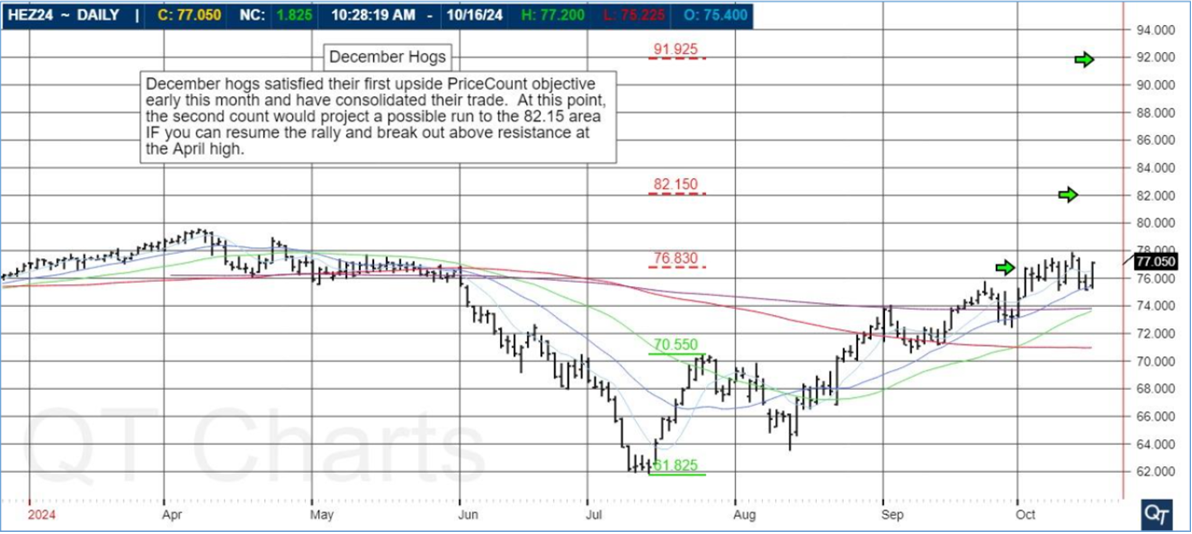
July meal stabilized its slide after completing its third downside PriceCount objective and developed an extended sideway trading range. The chart broke out of its range to the topside and activated upside counts in the process. On the rally, the first count to the $368 area has been satisfied where it would be normal to see a near term reaction in the form of a consolidation or corrective trade. From here, if you can sustain further strength, the second count would project a run to the $382 area.
PriceCounts – Not about where we’ve been , but where we might be going next!
b4cd70e9 11c1 4f77 943b b9e9bce3bfd1
The PriceCount study is a tool that can help to project the distance of a move in price. The counts are not intended to be an ‘exact’ science but rather offer a target area for the four objectives which are based off the first leg of a move with each subsequent count having a smaller percentage of being achieved. It is normal for the chart to react by correcting or consolidating at an objective and then either resuming its move or reversing trend. Best utilized in conjunction with other technical tools, PriceCounts offer one more way to analyze charts and help to manage your positions and risk. Learn more at www.qtchartoftheday.com
Trading in futures, options, securities, derivatives or OTC products entails significant risks which must be understood prior to trading and may not be appropriate for all investors. Past performance of actual trades or strategies is not necessarily indicative of future results.
Where do I exit My Trade?? Watch video below.
Projecting possible targets when trading futures
  • Broker’s Trading System of the Week

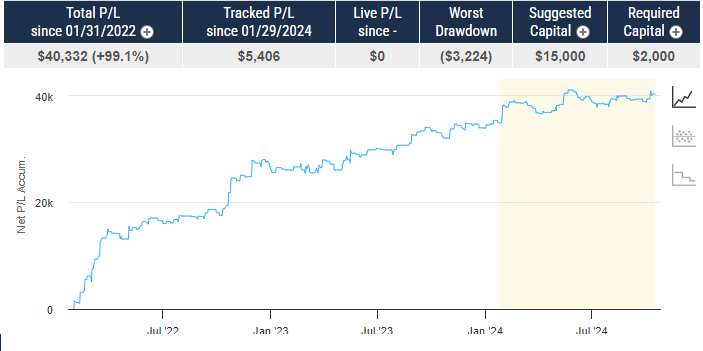
With algorithmic trading systems becoming more prevalent in portfolio diversification, the following system has been selected as the broker’s choice for this month.
PRODUCT
SYSTEM TYPE
Intraday
COST
USD 127 / monthly
Recommended Cannon Trading Starting Capital
$30,000
c72ec47f cff0 4723 b3a1 4af0b39e50d0
The performance shown above is hypothetical in that the chart represents returns in a model account. The model account rises or falls by the average single contract profit and loss achieved by clients trading actual money pursuant to the listed system’s trading signals on the appropriate dates (client fills), or if no actual client profit or loss available – by the hypothetical single contract profit and loss of trades generated by the system’s trading signals on that day in real time (real‐time) less slippage, or if no real time profit or loss available – by the hypothetical single contract profit and loss of trades generated by running the system logic backwards on back adjusted data. Please read full disclaimer HERE.
Would you like to receive daily support & resistance levels?
Yes
S
No
S


Daily Levels for May 6th 2024

7cf9d959 5b01 408d 9e54 ca19f32316f0

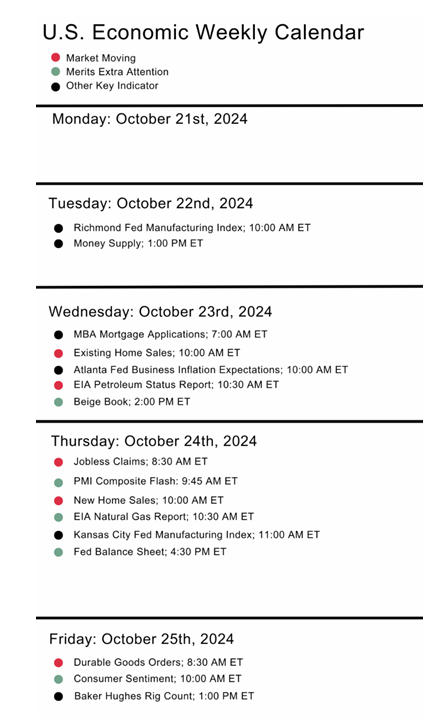
Trading Reports for Next Week

5fdf91a0 c0ef 464a 92de 8910660b5117
d259df9c bf07 4429 9fa8 d12b53c37804
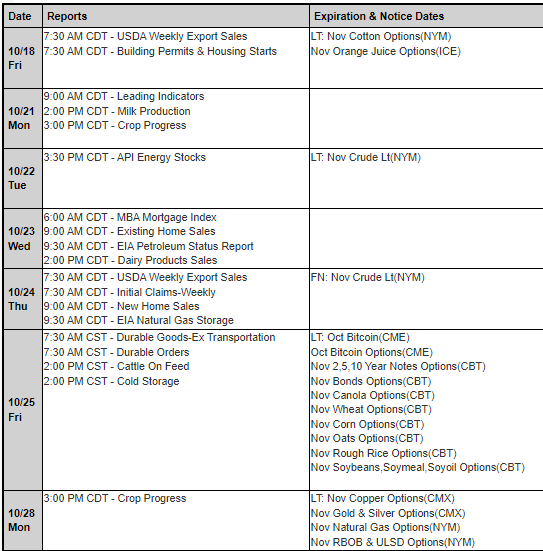
First Notice (FN), Last trading (LT) Days for the Week:
5aea76a3 b070 4980 955d 9fb247483b7a

Improve Your Trading Skills

Get access to proprietary indicators and trading methods, consult with an experienced broker at 1-800-454-9572.

Explore trading methods. Register Here

* This is not a solicitation of any order to buy or sell, but a current market view provided by Cannon Trading Inc. Any statement of facts here in contained are derived from sources believed to be reliable, but are not guaranteed as to accuracy, nor they purport to be complete. No responsibility is assumed with respect to any such statement or with respect to any expression of opinion herein contained. Readers are urged to exercise their own judgement in trading.

Support & Resistance Levels For Trading Markets | Cannon Trading

Get Real Time updates and more by joining our Private Facebook Group!
Subscribe to our YouTube Channel


C49


Bullet Points & Highlights:

  • Today Coffee and Cocoa were down considerably again, Cocoa closing at the lowest level since Mid March @ $75.63 That’s $43.00 off the Contract all time highs less than 2 weeks ago.
  • It Looks like the Soy Complex is lifting off with July Beans 28 cents higher and Soymeal $16.00 higher

122c8b81 f421 4f2e 9881 a82d2b5ce46b

  • Next week will again be a heavy Earnings Week
  • Next week a quiet Econ Data week


Commodity Trading Challenge with Real Cash Prizes!

https://cmegroup.com/futures_challenge/challenges/1043/landing?challenge_sponsored_broker=CannonTrading

Challenge Details

Our commodity benchmarks fuel economies worldwide, from oil to copper to grains and more. Explore the benefits of trading the world’s most liquid physical futures markets.

  • All trades during the competition will be completed in the Challenge Simulator.
  • All traders will begin with a virtual account of $100,000, aiming to maximize their balance by the competition’s close.
  • Cash prizes will be awarded to the top three eligible traders with the highest account balances in the Overall Leaderboard and also to the top trader from each of the Alternate Leaderboards (up to six total prizes available, each with a cash value as set forth to the right; traders are only eligible for one prize).

GET STARTED

705bedbc efec 480b b87b 9e60563167f5


stars

e35cb555 9ff3 4f00 9fe8 0655b28fbd90

Daily Levels for May 3rd, 2024

2c32c654 12e1 424f 9785 587040c253b2

Economic Reports
provided by: ForexFactory.com
All times are Eastern Time ( New York)
06246338 ae06 4db2 822f e976705d025c

Improve Your Trading Skills

Get access to proprietary indicators and trading methods, consult with an experienced broker at 1-800-454-9572.

Explore trading methods. Register Here

3b644da2 2bee 4d39 8d98 5208a20bec39

* This is not a solicitation of any order to buy or sell, but a current market view provided by Cannon Trading Inc. Any statement of facts here in contained are derived from sources believed to be reliable, but are not guaranteed as to accuracy, nor they purport to be complete. No responsibility is assumed with respect to any such statement or with respect to any expression of opinion herein contained. Readers are urged to exercise their own judgement in trading.

Post-FOMC Pre-NFP Futures Market Levels for May 2nd | Cannon Trading

Get Real Time updates and more by joining our Private Facebook Group!
Subscribe to our YouTube Channel


C49


Post FOMC, Pre NFP – The Rest of the Week in the Futures Markets:

By Mark O’Brien, Senior Broker:


In meeting after meeting, Federal Reserve officials have been saying that the path to achieving their 2% inflation goal would be a bumpy one.  For the first quarter of 2024, “there has been a lack of further progress toward the (Fed’s) two percent inflation objective,” according to the central bank’s statement following today’s conclusion of it most recent Federal Open Market Committee meeting.


As such, the Fed kept the federal funds rate target range at 5.25% to 5.5%, a 23-year high.  This move – or the absence of one – was highly anticipated.  Indeed, Fed watchers expect the central bank to hold rates steady through its next meeting in June – for the seventh consecutive time – and likely further on out.  In one readers survey conducted by Seeking Alpha, over half the participants don’t see any rate cuts in 2024.  Patience seems to be the order of the day as Fed Chair Jay Powell explained earlier this month: the current restrictive policy needs more time to work as the labor market remains strong and disinflationary dynamics have stalled.


The next economic mover and shaker up this week: the Labor Department’s April Non-Farm Payrolls Report, to be released Friday, 7:30 A.M., Central Time.  The precursor to this came today in the form of the ADP employment report, which revealed that 192,000 private jobs were added in April, a slowdown from the 208,000 private jobs added the prior month.  The latest reading came in higher than the expected 179,000 addition of new private jobs. The forecast for nonfarm payrolls is for 243,000 jobs to have been added.

Commodity Trading Challenge with Real Cash Prizes!

https://cmegroup.com/futures_challenge/challenges/1043/landing?challenge_sponsored_broker=CannonTrading

Challenge Details

Our commodity benchmarks fuel economies worldwide, from oil to copper to grains and more. Explore the benefits of trading the world’s most liquid physical futures markets.

  • All trades during the competition will be completed in the Challenge Simulator.
  • All traders will begin with a virtual account of $100,000, aiming to maximize their balance by the competition’s close.
  • Cash prizes will be awarded to the top three eligible traders with the highest account balances in the Overall Leaderboard and also to the top trader from each of the Alternate Leaderboards (up to six total prizes available, each with a cash value as set forth to the right; traders are only eligible for one prize).

GET STARTED

705bedbc efec 480b b87b 9e60563167f5


stars

e35cb555 9ff3 4f00 9fe8 0655b28fbd90

Daily Levels for May 2nd, 2024

8e653aff 0f80 46a6 8a50 068c384cf1ca

Economic Reports
provided by: ForexFactory.com
All times are Eastern Time ( New York)
d2ba71ac 0f2d 411d bd9e 2201871d0234

Improve Your Trading Skills

Get access to proprietary indicators and trading methods, consult with an experienced broker at 1-800-454-9572.

Explore trading methods. Register Here

3b644da2 2bee 4d39 8d98 5208a20bec39

* This is not a solicitation of any order to buy or sell, but a current market view provided by Cannon Trading Inc. Any statement of facts here in contained are derived from sources believed to be reliable, but are not guaranteed as to accuracy, nor they purport to be complete. No responsibility is assumed with respect to any such statement or with respect to any expression of opinion herein contained. Readers are urged to exercise their own judgement in trading.

FOMC Levels for May 1st: Support & Resistance Insights | Cannon Trading

Get Real Time updates and more by joining our Private Facebook Group!
Subscribe to our YouTube Channel


C48


FOMC Rate decision tomorrow in addition to, ISM, JOLTS and PMI!

We expect heightened volatility.


Commodity Trading Challenge with Real Cash Prizes!

https://cmegroup.com/futures_challenge/challenges/1043/landing?challenge_sponsored_broker=CannonTrading

Challenge Details

Our commodity benchmarks fuel economies worldwide, from oil to copper to grains and more. Explore the benefits of trading the world’s most liquid physical futures markets.

  • All trades during the competition will be completed in the Challenge Simulator.
  • All traders will begin with a virtual account of $100,000, aiming to maximize their balance by the competition’s close.
  • Cash prizes will be awarded to the top three eligible traders with the highest account balances in the Overall Leaderboard and also to the top trader from each of the Alternate Leaderboards (up to six total prizes available, each with a cash value as set forth to the right; traders are only eligible for one prize).

GET STARTED

705bedbc efec 480b b87b 9e60563167f5


stars

e35cb555 9ff3 4f00 9fe8 0655b28fbd90

Daily Levels for May 1st, 2024

fd9987e0 3723 4901 802a dc74eb0b9fba

Economic Reports
provided by: ForexFactory.com
All times are Eastern Time ( New York)
3905d16b e64c 448d a275 342eef1b6917

Improve Your Trading Skills

Get access to proprietary indicators and trading methods, consult with an experienced broker at 1-800-454-9572.

Explore trading methods. Register Here

3b644da2 2bee 4d39 8d98 5208a20bec39

* This is not a solicitation of any order to buy or sell, but a current market view provided by Cannon Trading Inc. Any statement of facts here in contained are derived from sources believed to be reliable, but are not guaranteed as to accuracy, nor they purport to be complete. No responsibility is assumed with respect to any such statement or with respect to any expression of opinion herein contained. Readers are urged to exercise their own judgement in trading.

Weather Markets, Economic Data & Earnings Report | Cannon Trading

Get Real Time updates and more by joining our Private Facebook Group!
Subscribe to our YouTube Channel


C36 1


Weather markets, Economic data and earnings reports creating Volatility in many market: Week Ahead


by John Thorpe, Senior Broker

  • FOMC Rate Announcement Wed.
  • Heavy Earnings, AMZN and AMD Tues, AAPL Thur. all after the close
  • Heavy Data, Chicago PMI, Consumer Confidence, Construction Spending, ISM Manufacturing PMI, Jobless Claims and NON FARM Payrolls to cap off the week on Fri. , preopening


After a record setting rally in the Cocoa market this year due to a number of factors including dry weather, disease and shuttering of processing plants due to a lack of a meaningful crop; the cocoa market reversed course today and literally melted down to a 3 week low as a shift toward wetter weather over the west African growing region pushed the Price of July Cocoa under the 21 day moving average of $101.16. Highs of $117.92 were reached 10 days ago only to see the market today close down $14.51 TO $91.73 and if you are counting, today’s move alone was a whopping $14,510.00 lower than Friday’s closing price. That’s a Weather market!


Domestically Wheat was Up 10% last week and down 2.25% today, that’s still 28 cents above it’s 21 day moving average.


Here is a worthy read about the “Nature of Weather Markets”

Historically, a pivotal timeframe for the grain futures markets has been right around the U.S. Independence Day holiday in early July. Existing price trends in the grain futures markets can be reversed or accelerated during this critical juncture of the U.S. growing season–especially for corn. Indeed, mid- to late-July typically finds the hottest weather of the year in the Corn Belt. This time period coincides with the extreme-heat-sensitive pollination stage of corn crop development. August is the most critical growing month for U.S. soybeans.

Says Conrad Leslie, the longtime and highly respected crop forecaster and market commentator: “Following the July Fourth holiday period, those who are interested in soybean and corn prices and production estimates look to the skies for the next two months for weather developments. Historical statistics indicate crops can either improve or decline….”

As an historical example, 1988 was a major drought year in the Midwest that saw corn and soybean futures prices skyrocket. It was on a Friday in July that saw corn and soybean futures prices trade sharply higher, based on ideas the hot and dry weather would continue in the U.S. Corn Belt. Then, after the close of grain futures Friday afternoon, the National Weather Service issued its 6-10 day forecast that, sure enough, called for more hot and dry weather for the Corn Belt. Corn and soybean bulls confidently headed home for the weekend.

On Monday morning, the updated weather forecasts had changed a bit, but more importantly, trader psychology had changed immensely. The drought and resulting poor U.S. corn and soybean yields had all been factored into the market with prior price gains, culminating with that Friday’s big push higher. Corn and bean markets traded limit down on Monday and recorded very sharp losses for around three days in a row.

One trader who used contrary opinion thinking during that timeframe purchased put options on corn futures that Friday in which prices were pushing higher. He made a good deal of money that next week.

Weather markets in grains many times provide a classic example of futures traders “factoring in” fundamental events well before they actually occur. For example, in the big drought year of 1988, the soybean crop was most damaged during the months of July and August. Yet, futures prices that year topped out the third week in June.

Finally, trading the grains in a summertime weather market can be just plain fun. Those traders who don’t have expensive “real-time” newswire feeds or other connections right to the trading floor of the Chicago Board of Trade can still log-in to the internet and go to CannonTradings website www.cannontrading.com for daily price and news updates. Or you can listen to the Midwest weather forecasts and ag news on the radio–or look at weather maps on the weather websites on the Internet.

4ede780c 7c6e 441d b6aa bb08a3ca20e9


stars

e35cb555 9ff3 4f00 9fe8 0655b28fbd90

Daily Levels for April 30th, 2024

201c22a7 8775 4498 83f9 6cdc748120cb

b5b078e6 66c6 4fc3 8c02 baae8fe2ac51

Economic Reports
provided by: ForexFactory.com
All times are Eastern Time ( New York)
bd130662 5ba0 4cf5 bbbf 614a81c91341

Improve Your Trading Skills

Get access to proprietary indicators and trading methods, consult with an experienced broker at 1-800-454-9572.

Explore trading methods. Register Here

3b644da2 2bee 4d39 8d98 5208a20bec39

* This is not a solicitation of any order to buy or sell, but a current market view provided by Cannon Trading Inc. Any statement of facts here in contained are derived from sources believed to be reliable, but are not guaranteed as to accuracy, nor they purport to be complete. No responsibility is assumed with respect to any such statement or with respect to any expression of opinion herein contained. Readers are urged to exercise their own judgement in trading.

Weekly Newsletter: FOMC next Week, Bonds Outlook & Trading Levels for April 29th

Get Real Time updates and more by joining our Private Facebook Group!
Subscribe to our YouTube Channel

C47

Cannon Futures Weekly Letter Issue # 1191

In this issue:
  • Important Notices – FOMC & NFP Next Week
  • Futures 101 – Understanding Volume
  • Hot Market of the Week – June Bonds
  • Broker’s Trading System of the Week – ES intraday System
  • Trading Levels for Next Week
  • Trading Reports for Next Week


Important Notices – Next Week Highlights:

    • FOMC Rate Announcement Wed.
    • Heavy Earnings, AMZN and AMD Tues, AAPL Thur. all after the close
    • Heavy Data, Chicago PMI, Consumer Confidence, Construction Spending, ISM Manufacturing PMI, Jobless Claims.
    • NON FARM Payrolls to cap off the week on Fri. , preopening


Futures 101 : Understanding VOLUME

Volume is reported for all futures contracts. It is calculated by counting the number of contracts that have been bought and sold over a given time. You can track volume using different time intervals like daily or intraday.
When a futures contract is traded, whether bought or sold, it counts towards volume for that contract.
For example, a trader closes a short position in the E-mini S&P 500 (ES) futures contract by buying one contract in the ES, so volume will increase by 1.
Traders often use and interpret the rise or decline of volume in a futures contract to help make trading decisions.
Volume can give important information to traders such as:
  • Indicate the price levels at which traders are more or less interested in trading a futures contract
  • During the roll, indicate to traders when to switch to trading the front month futures contract as volume decreases in the expiring contract
  • Identify the times of day when a futures contract is most liquid
Price Levels
When volume changes as price of a futures contract moves towards certain levels, this can indicate to a trader that a change in direction may occur. Some traders may use this information to indicate whether to buy or sell at those key levels.
­Contract Roll
During the futures rollover, traders pay attention to the contract that is taking the higher levels of volume. Traders use this information to determine when to start trading the next month contract. As volume decreases in the expiring contract, trading will shift to the next available month contract.
For example, say the June ES (E-mini S&P 500) futures contract is about to expire and September will become the new front month. On the Thursday of rollover week, watch how the June contract starts to lose volume and the September contract begins to pick up volume. When the September contract has more volume than the June contract, it is time to switch to the September contract.
Active Periods
Traders typically prefer higher volume times to trade, as it means that more traders are actively interested in buying and selling. When volume is high, the bid-ask spread is typically smaller, orders are filled faster and less gaps may exist between ticks.
For example, markets can have lower volume between the hours of 12:00 p.m.-2:00 p.m. ET, before major economic releases; conversely, market often see higher volume around the open and close of the trading day.
Traders also can look at average daily volume over a longer time period, such as a few weeks or months, to see if the markets currently are in a lower or higher volume than is typical.
Summary
What volume can’t show however, is whether traders are buying or selling, or opening or closing a position.
For example, if the ES contract is trading at 2375 and suddenly pushes down to 2360 while volume increases, the volume that comes into the market could be from traders opening new long positions at key levels of support. That could indicate a bullish sentiment. Volume also can be generated by liquidation of exiting long positions or opening of new short positions, a possible bearish indication.
A spike in volume at 2360 doesn’t necessarily mean that buyers are coming into the market and that the price will bounce.
Volume data is readily available for each futures contract and for the market as a whole. Although traders may use volume in different ways to interpret how to trade, volume can be an important factor to help inform your trading decisions.


stars

3b644da2 2bee 4d39 8d98 5208a20bec39


  • Hot Market of the Week – June Bonds
Hot market of the week is provided by QT Market Center, A Swiss army knife charting package that’s not just for Hedgers, Cooperatives and Farmers alike but also for Spread traders, Swing traders and shorter time frame application for intraday traders with a unique proprietary indicator that can be applied to your specific trading needs.
June 30 Year T-Bonds
The June 30 Year T-Bond break found temporary stability at its second downside PriceCount objective recently. Now, the chart has resumed its slide into new lows which, if sustained, would project a run to the third count in the 109^20 area.
PriceCounts – Not about where we’ve been , but where we might be going next!
e705ddd3 93f1 4833 80e3 d1e808fbc117
The PriceCount study is a tool that can help to project the distance of a move in price. The counts are not intended to be an ‘exact’ science but rather offer a target area for the four objectives which are based off the first leg of a move with each subsequent count having a smaller percentage of being achieved. It is normal for the chart to react by correcting or consolidating at an objective and then either resuming its move or reversing trend. Best utilized in conjunction with other technical tools, PriceCounts offer one more way to analyze charts and help to manage your positions and risk. Learn more at www.qtchartoftheday.com
Trading in futures, options, securities, derivatives or OTC products entails significant risks which must be understood prior to trading and may not be appropriate for all investors. Past performance of actual trades or strategies is not necessarily indicative of future results.
  • Broker’s Trading System of the Week

With algorithmic trading systems becoming more prevalent in portfolio diversification, the following system has been selected as the broker’s choice for this month.
PRODUCT
SYSTEM TYPE
Intraday
COST
USD 110 / monthly
Recommended Cannon Trading Starting Capital
$10,000
a5fd1228 3ba8 42c5 a40d c3e46544bdd0
The performance shown above is hypothetical in that the chart represents returns in a model account. The model account rises or falls by the average single contract profit and loss achieved by clients trading actual money pursuant to the listed system’s trading signals on the appropriate dates (client fills), or if no actual client profit or loss available – by the hypothetical single contract profit and loss of trades generated by the system’s trading signals on that day in real time (real‐time) less slippage, or if no real time profit or loss available – by the hypothetical single contract profit and loss of trades generated by running the system logic backwards on back adjusted data. Please read full disclaimer HERE.
Would you like to receive daily support & resistance levels?
Yes
S
No
S


Daily Levels for April 29th 2024

eb118b97 a50d 48fb ab4a efafa6ff5968

Trading Reports for Next Week

d398c77d 24dc 450b 92fb ef3ef27b13d9
d259df9c bf07 4429 9fa8 d12b53c37804
First Notice (FN), Last trading (LT) Days for the Week:
6d1a7821 c606 4107 83ef 6fa197eb7433

Improve Your Trading Skills

Get access to proprietary indicators and trading methods, consult with an experienced broker at 1-800-454-9572.

Explore trading methods. Register Here

* This is not a solicitation of any order to buy or sell, but a current market view provided by Cannon Trading Inc. Any statement of facts here in contained are derived from sources believed to be reliable, but are not guaranteed as to accuracy, nor they purport to be complete. No responsibility is assumed with respect to any such statement or with respect to any expression of opinion herein contained. Readers are urged to exercise their own judgement in trading.

PCE Tomorrow!  + Levels for April 26th

Get Real Time updates and more by joining our Private Facebook Group!
Subscribe to our YouTube Channel


C46


The U.S. GDP experienced a modest increase of 1.6% in the first quarter, marking the slowest expansion in two years. This news prompted a downturn in U.S. stock markets. But should investors be concerned about this figure?

Ben Laidler, the Global Markets Strategist at eToro, appeared on Wealth! to shed light on the implications of the GDP data for investor portfolios.

Laidler commented, “The recent GDP figure isn’t ideal, yet it’s not as dire as it may seem. The core elements that matter to us—business investment and consumer spending—are holding strong. The observed softness is largely attributed to less critical factors, which are expected to rebound in the next quarter, specifically trade and inventory levels.

  • While the inflation metric is slightly unsettling, it’s best to wait for the upcoming release of the monthly Personal Consumption Expenditures (PCE) index. This will provide us with more clarity on the extent of our concerns regarding the current economic situation.”


stars

e35cb555 9ff3 4f00 9fe8 0655b28fbd90

Daily Levels for April 26th, 2024

c966fcd9 e95b 47a3 a4d4 aa6f33599e0a

b5b078e6 66c6 4fc3 8c02 baae8fe2ac51

Economic Reports
provided by: ForexFactory.com
All times are Eastern Time ( New York)
b0f74ff4 de2a 4aa0 85d8 24b8d3f73d7f

Improve Your Trading Skills

Get access to proprietary indicators and trading methods, consult with an experienced broker at 1-800-454-9572.

Explore trading methods. Register Here

3b644da2 2bee 4d39 8d98 5208a20bec39

* This is not a solicitation of any order to buy or sell, but a current market view provided by Cannon Trading Inc. Any statement of facts here in contained are derived from sources believed to be reliable, but are not guaranteed as to accuracy, nor they purport to be complete. No responsibility is assumed with respect to any such statement or with respect to any expression of opinion herein contained. Readers are urged to exercise their own judgement in trading.

GDP Tomorrow, Earnings Season in Full Play  + Levels for April 25th

Get Real Time updates and more by joining our Private Facebook Group!
Subscribe to our YouTube Channel


C30


A few tips for tomorrow:

  • If you are trading stock index futures, note price action has been VERY choppy during the day session as most earnings come out after the close…
  • Coffee and Coca volatility is as high as I have seen in recent months. Large intraday and overnight moves in both, as much as +/- 8% per day!
  • We have GDP and home sales tomorrow.
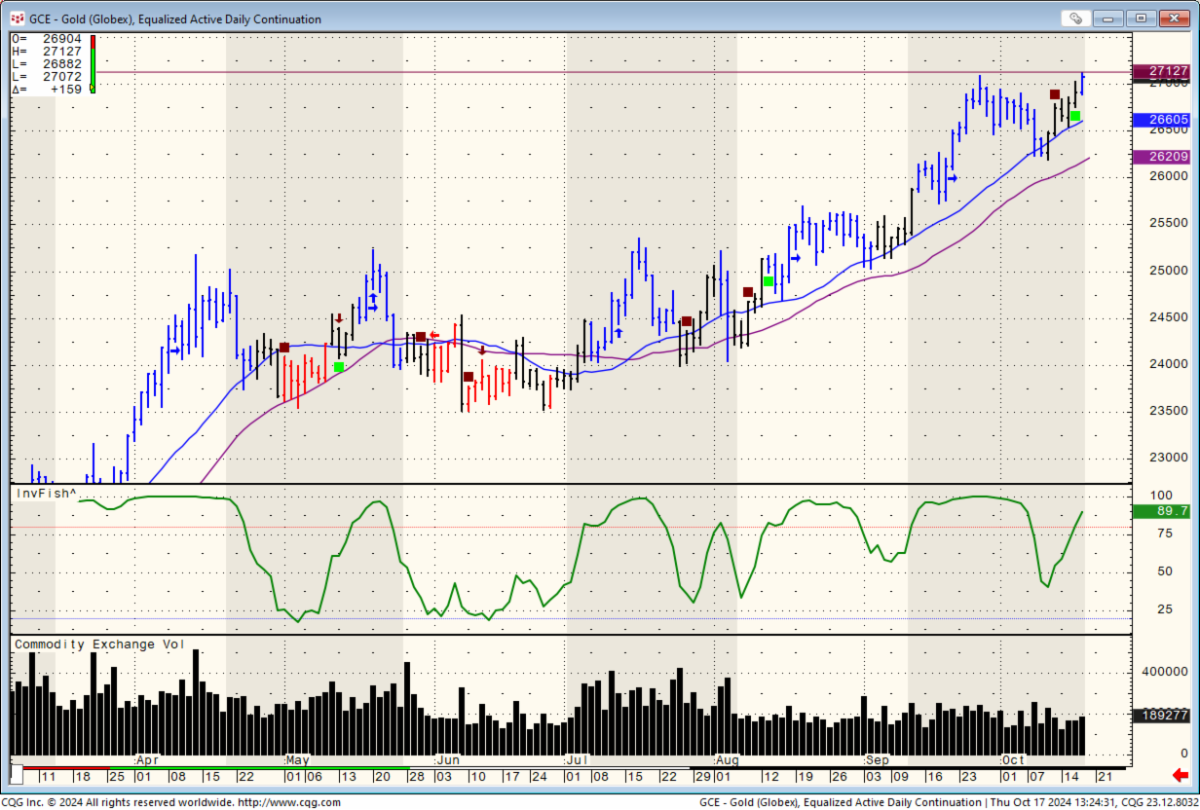
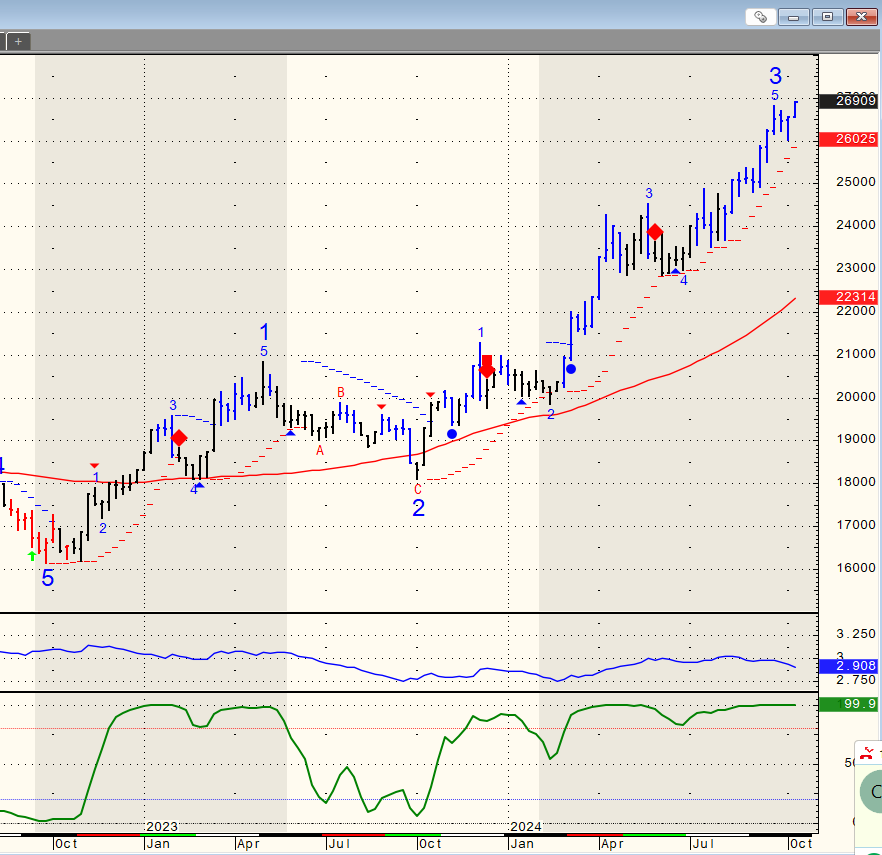
  • Big pullback in both silver and gold and the key question is: Was this profit taking/ deflation of geo political fear and GOOD entry to the long side? OR…is this the near term top for both markets??
  • Corn daily chart for your review below.

91d5fe9f befc 4c02 b5d6 4fe775ba7b0e


stars

e35cb555 9ff3 4f00 9fe8 0655b28fbd90

Daily Levels for April 25th, 2024

c966fcd9 e95b 47a3 a4d4 aa6f33599e0a

thumbnail?url=http%3A%2F%2Fi.ytimg.com%2Fvi%2FJnHAMUGdNoM%2Fhqdefault

Economic Reports
provided by: ForexFactory.com
All times are Eastern Time ( New York)
7d0dfe51 9084 4e90 9e70 216bff610617

Improve Your Trading Skills

Get access to proprietary indicators and trading methods, consult with an experienced broker at 1-800-454-9572.

Explore trading methods. Register Here

3b644da2 2bee 4d39 8d98 5208a20bec39

* This is not a solicitation of any order to buy or sell, but a current market view provided by Cannon Trading Inc. Any statement of facts here in contained are derived from sources believed to be reliable, but are not guaranteed as to accuracy, nor they purport to be complete. No responsibility is assumed with respect to any such statement or with respect to any expression of opinion herein contained. Readers are urged to exercise their own judgement in trading.

Bullet Points, Highlights, Announcements  + Levels for April 24th

Get Real Time updates and more by joining our Private Facebook Group!
Subscribe to our YouTube Channel


C37

Bullet Points, Highlights, Announcements   

by Mark O’Brien, Senior Broker

General:  


Futures traders with positions in deliverable futures contracts keep an eye on the calendar for important dates at the end of the month. First Notice Day (FND) and Last Trading Day (LTD) for many futures contracts are close at hand. Make sure you steer safely clear of receiving delivery notices for physical commodities (FND), or greatly reduced liquidity (LTD). If you’re unsure, contact your Cannon Trading Co. broker.


The economic calendar for the rest of the week is scarce with Thursday’s Q1 GDP report taking center stage.


Prospects for a fed rate cut announcement at the Fed’s 4/30-5/1 meeting, as well as its mid-June meeting have all but evaporated and many Fed watchers expect the central bank to keep its “higher for longer” mantra in place for most and possibly all of 2024.


Worries over a wider Middle East conflict have subsided and traders are discounting the risk of further escalations. Case in point, June gold lost ±67 per ounce (±2%) yesterday after posting its latest all-time record high close of $2,413.80/ounce on Friday. Iran downplayed Israel’s retaliatory drone strike against it, in what appeared to be a move aimed at averting regional escalation.


Energies: 


  • The ±$2.50/barrel selloff in May crude oil and the ±¢9.75/gallon May RBOB gasoline futures last week likely signaled the markets do not see an Iranian supply disruption in the near future, so the markets will be given to focusing on global energy demand going forward

47489e7c 5065 45b3 8e85 55c7ad3a0f3e


Softs:  


May Cocoa futures declined sharply yesterday and today, down nearly $1,300/ton (a $13,000 per contract move) marking its worst two-day slump since February. This after a 3-day / Wed.-Fri. rally of $1,635/ton to its all-time record high close of 11,878/ton on Friday. ICE U.S. has set the initial margin requirement to $11,260 per contract.

stars

e35cb555 9ff3 4f00 9fe8 0655b28fbd90

Daily Levels for April 24th, 2024

b8b30c15 9c5e 43f1 858e 25ebcd94928e

thumbnail?url=http%3A%2F%2Fi.ytimg.com%2Fvi%2FJnHAMUGdNoM%2Fhqdefault

Economic Reports
provided by: ForexFactory.com
All times are Eastern Time ( New York)
f4aacb3b d0e3 45f4 82bf 45cec9587768

Improve Your Trading Skills

Get access to proprietary indicators and trading methods, consult with an experienced broker at 1-800-454-9572.

Explore trading methods. Register Here

3b644da2 2bee 4d39 8d98 5208a20bec39

* This is not a solicitation of any order to buy or sell, but a current market view provided by Cannon Trading Inc. Any statement of facts here in contained are derived from sources believed to be reliable, but are not guaranteed as to accuracy, nor they purport to be complete. No responsibility is assumed with respect to any such statement or with respect to any expression of opinion herein contained. Readers are urged to exercise their own judgement in trading.