Hello Traders,
For 2014 I would like to wish all of you discipline and patience in your trading!
I have posted an analysis of coffee futures market ( medium term time frame) at:
http://experts.forexmagnates.com/coffee-futures-break-fake/
In between going back to day trading, I mentioned to clients before that I prefer volume charts, range bar charts and Renko charts for any time frame that is less than 15 minutes. Main reason in few words is that these type of charts can sometimes provide you with a faster signal when there is action in the market and may sometimes filter our “noise signals” when markets are quiet with low volume.
Below you will see my “longer term day trading chart” I use for mini Russell. It is a 36 ticks range bar chart. You will be to view the few signals I got this past few days.
Range Bar Charts:
A Range Bar chart is constructed of bars that indicate price movement as a way to help expose trends and volatility. A bar is created each time the bar range (high to low) is equal to some value that you set in preferences.
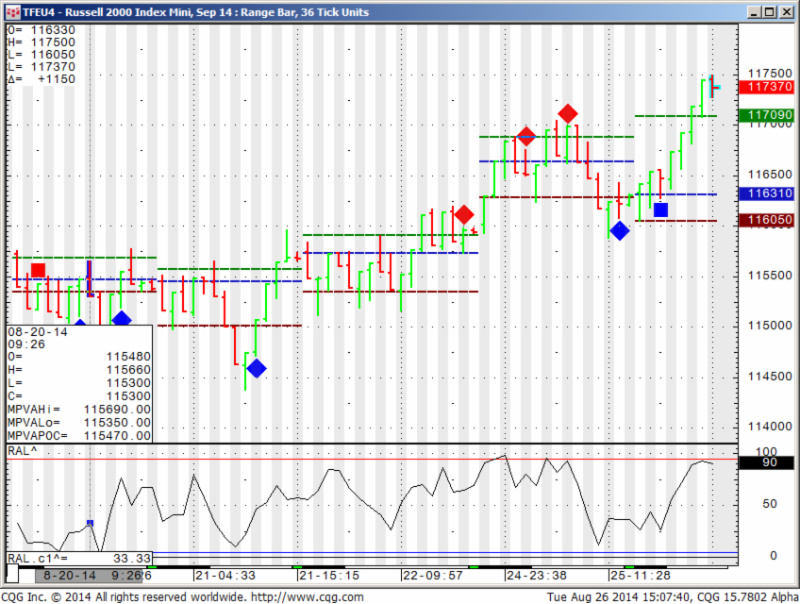
Would you like to have access to my DIAMOND and TOPAZ ALGOs as shown above
and be able to apply for any market and any time frame on your own PC ? You can now have a three weeks free trial where I enable the ALGO along with few studies for your own sierra/ ATcharts.
To start your trial, please visit: http://levex.net/trading-algo/
HYPOTHETICAL PERFORMANCE RESULTS HAVE MANY INHERENT LIMITATIONS, SOME OF WHICH ARE DESCRIBED BELOW. NO REPRESENTATION IS BEING MADE THAT ANY ACCOUNT WILL OR IS LIKELY TO ACHIEVE PROFITS OR LOSSES SIMILAR TO THOSE SHOWN. IN FACT, THERE ARE FREQUENTLY SHARP DIFFERENCES BETWEEN HYPOTHETICAL PERFORMANCE RESULTS AND THE ACTUAL RESULTS SUBSEQUENTLY ACHIEVED BY ANY PARTICULAR TRADING PROGRAM.
ONE OF THE LIMITATIONS OF HYPOTHETICAL PERFORMANCE RESULTS IS THAT THEY ARE GENERALLY PREPARED WITH THE BENEFIT OF HINDSIGHT. IN ADDITION, HYPOTHETICAL TRADING DOES NO INVOLVE FINANCIAL RISK, AND NO HYPOTHETICAL TRADING RECORD CAN COMPLETELY ACCOUNT FOR THE IMPACT OF FINANCIAL RISK IN ACTUAL TRADING. FOR EXAMPLE, THE ABILITY TO WITHSTAND LOSSES OR TO ADHERE TO A PARTICULAR TRADING PROGRAM IN SPITE OF TRADING LOSSES ARE MATERIAL POINTS WHICH CAN ALSO ADVERSELY AFFECT ACTUAL TRADING RESULTS. THERE ARE NUMEROUS OTHER FACTORS RELATED TO THE MARKETS IN GENERAL OR TO THE IMPLEMENTATION OF ANY SPECIFIC TRADING PROGRAM WHICH CANNOT BE FULLY ACCOUNTED FOR IN THE PREPARATION OF HYPOTHETICAL PERFORMANCE RESULTS AND ALL OF WHICH CAN ADVERSELY AFFECT ACTUAL TRADING RESULTS
Trading Futures, Options on Futures, and retail off-exchange foreign currency transactions involves substantial risk of loss and is not suitable for all investors. You should carefully consider whether trading is suitable for you in light of your circumstances, knowledge, and financial resources. You may lose all or more of your initial investment. Opinions, market data, and recommendations are subject to change at any time. Past performance is not indicative to future results.
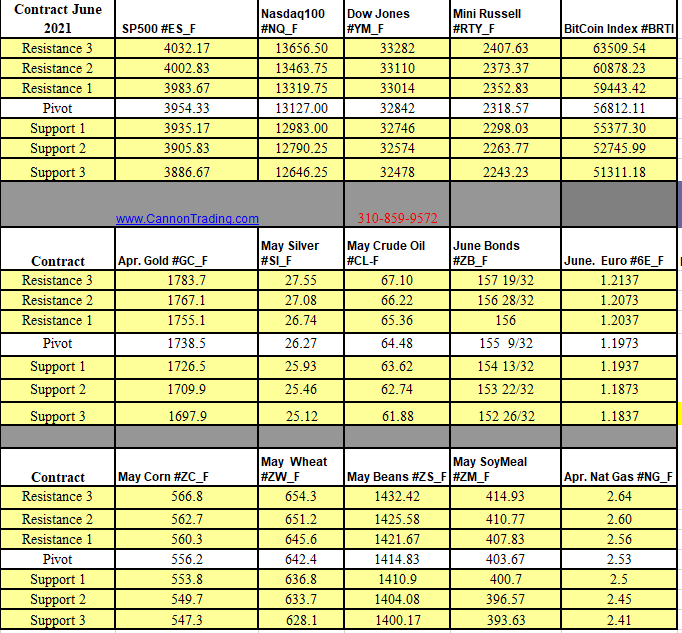
If you like Our Futures Trading Daily Support and Resistance Levels, Please share!
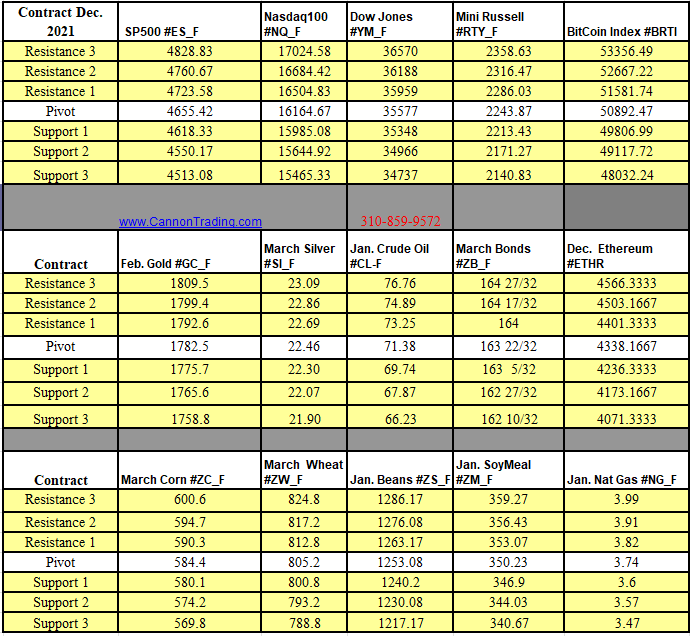
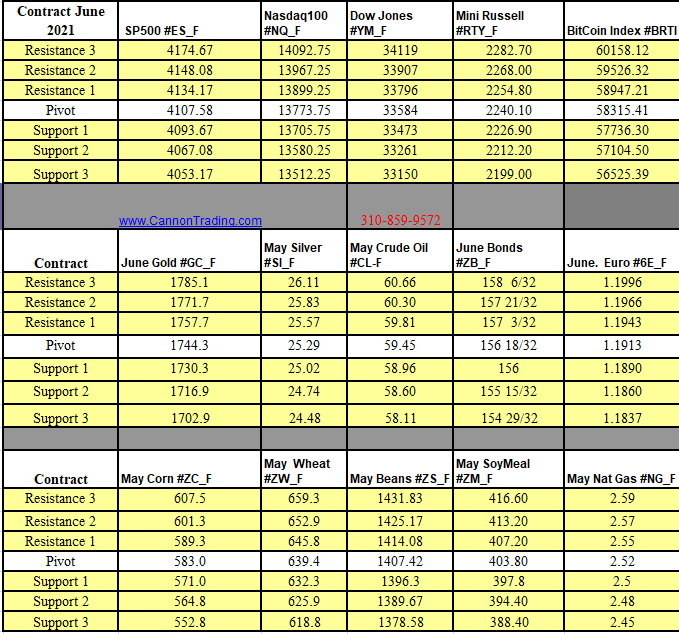
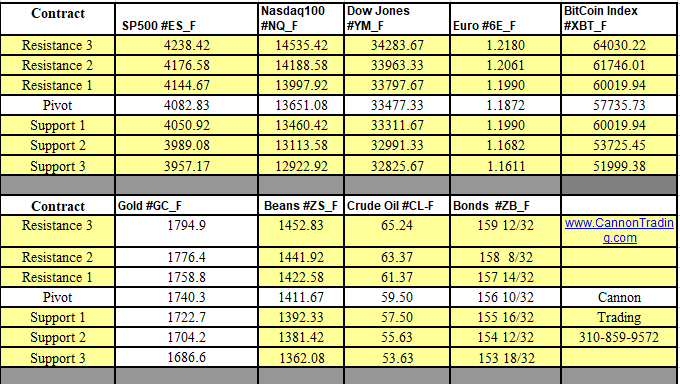
Futures Trading Levels
| Contract Sept. 2014 |
SP500 |
Nasdaq100 |
Dow Jones |
Mini Russell |
Dollar Index |
| Resistance 3 |
2013.92 |
4092.25 |
17235 |
1193.53 |
83.04 |
| Resistance 2 |
2008.33 |
4084.00 |
17183 |
1184.27 |
82.89 |
| Resistance 1 |
2003.42 |
4078.25 |
17140 |
1179.03 |
82.78 |
| Pivot |
1997.83 |
4070.00 |
17088 |
1169.77 |
82.63 |
| Support 1 |
1992.92 |
4064.25 |
17045 |
1164.53 |
82.53 |
| Support 2 |
1987.33 |
4056.00 |
16993 |
1155.27 |
82.38 |
| Support 3 |
1982.42 |
4050.25 |
16950 |
1150.03 |
82.27 |
|
|
|
|
|
|
| Contract |
December Gold |
Sept.Silver |
Oct. Crude Oil |
September Bonds |
Sept. Euro |
| Resistance 3 |
1307.4 |
19.9 |
95.34 |
141 18/32 |
1.3252 |
| Resistance 2 |
1299.6 |
19.8 |
94.85 |
141 10/32 |
1.3233 |
| Resistance 1 |
1291.2 |
19.6 |
94.34 |
140 28/32 |
1.3203 |
| Pivot |
1283.4 |
19.4 |
93.85 |
140 20/32 |
1.3184 |
| Support 1 |
1275.0 |
19.2 |
93.34 |
140 6/32 |
1.3154 |
| Support 2 |
1267.2 |
19.1 |
92.85 |
139 30/32 |
1.3135 |
| Support 3 |
1258.8 |
18.9 |
92.34 |
139 16/32 |
1.3105 |
|
|
|
|
|
|
| Contract |
Dec Corn |
Dec. Wheat |
Nov. Beans |
Dec. SoyMeal |
Dec. bean Oil |
| Resistance 3 |
371.9 |
558.0 |
1038.83 |
349.67 |
33.78 |
| Resistance 2 |
369.3 |
557.5 |
1033.67 |
347.23 |
33.49 |
| Resistance 1 |
367.2 |
557.0 |
1030.83 |
345.37 |
33.33 |
| Pivot |
364.6 |
556.5 |
1025.67 |
342.93 |
33.04 |
| Support 1 |
362.4 |
556.0 |
1022.8 |
341.1 |
32.9 |
| Support 2 |
359.8 |
555.5 |
1017.67 |
338.63 |
32.59 |
| Support 3 |
357.7 |
555.0 |
1014.83 |
336.77 |
32.43 |
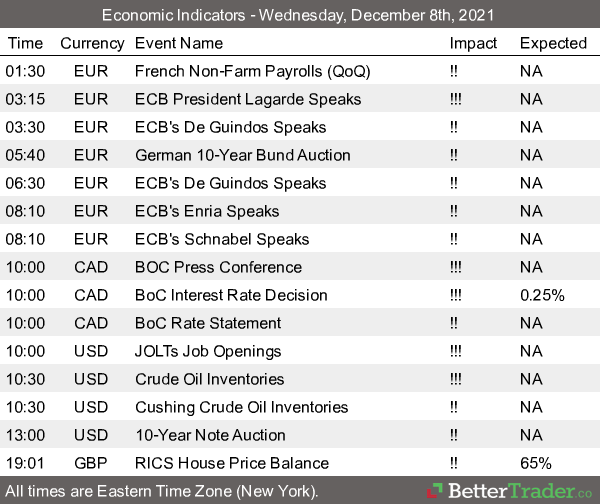
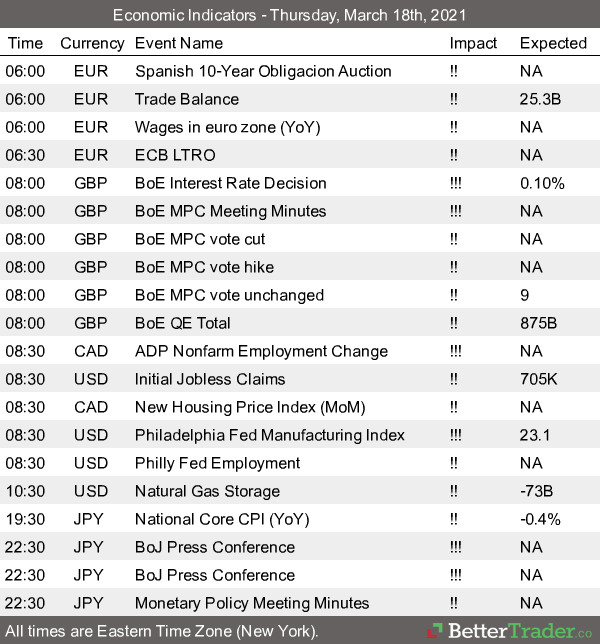
Economic Reports
| Date |
3:55pm |
Currency |
Impact |
|
Detail |
Actual |
Forecast |
Previous |
Graph |
|
| WedAug 27 |
2:00am |
CHF |
|
UBS Consumption Indicator |
|
|
|
2.06 |
|
|
|
EUR |
|
GfK German Consumer Climate |
|
|
8.9 |
9.0 |
|
|
|
EUR |
|
German Import Prices m/m |
|
|
-0.1% |
0.2% |
|
|
10:30am |
USD |
|
Crude Oil Inventories |
|
|
1.1M |
-4.5M |
|
|
Tentative |
AUD |
|
HIA New Home Sales m/m |
|
|
|
1.2% |
|
|
9:30pm |
AUD |
|
Private Capital Expenditure q/q |
|
|
-0.6% |
-4.2% |
This is not a solicitation of any order to buy or sell, but a current market view provided by Cannon Trading Inc. Any statement of facts here in contained are derived from sources believed to be reliable, but are not guaranteed as to accuracy, nor they purport to be complete. No responsibility is assumed with respect to any such statement or with respect to any expression of opinion herein contained. Readers are urged to exercise their own judgment in trading