mini SP 500

mini SP 500


Mini S&P Chart, Futures Levels & Economic Reports 2.20.2014

February 19th, 2014 Filed under Future Trading News | Comments Off on Mini S&P Chart, Futures Levels & Economic Reports 2.20.2014

Connect with Us! Use Our Futures Trading Levels and Economic Reports RSS Feed.

Like us on FacebookFollow us on TwitterView our profile on LinkedInFind us on Google+Cannon Trading Futures Trading Resistance & Support Levels and Economic ReportsFind us on Yelp

1. Market Commentary
2. Futures Support and Resistance Levels – S&P, Nasdaq, Dow Jones, Russell 2000, Dollar Index
3. Commodities Support and Resistance Levels – Gold, Euro, Crude Oil, T-Bonds
4. Commodities Support and Resistance Levels – Corn, Wheat, Beans, Silver
5. Futures Economic Reports for Thursday February 20, 2014

Hello Traders,

For 2014 I would like to wish all of you discipline and patience in your trading!

Below is a screen shot of the Mini Sp 500 chart I shared during today’s session with clients and prospects during our live trading signals session.

ESH4 2.00 Range #2 E-mini S&P 500 - CME

Would you like to have access to my DIAMOND and TOPAZ ALGOs as shown above and be able to apply for any market and any time frame on your own PC? You can now have a three weeks free trial where I enable the ALGO along with few studies for your own sierra/ ATcharts.

To start your trial, please visit:

If so, please send me an email with the following information:


1. Are you currently trading futures?

2. Charting software you use?

3. If you use sierra or ATcharts, please let me know the user name so I can enable you

4. Markets you currently trading?


Mini Russell 2000, Mini SP 500, Crude Oil, Gold futures Chart | Support and Resistance

May 9th, 2012 Filed under Crude Oil, Future Trading News, Metal Futures | Comments Off on Mini Russell 2000, Mini SP 500, Crude Oil, Gold futures Chart | Support and Resistance

Jump to a section in this post:
1. Market Commentary
2. Support and Resistance Levels – S&P, Nasdaq, Dow Jones, Russell 2000
3. Support and Resistance Levels – Gold, Euro, Crude Oil, T-Bonds
4. Support and Resistance Levels – Corn, Wheat, Beans, Silver
5. Economic Reports for Wednesday May 9, 2012


Hello Traders,

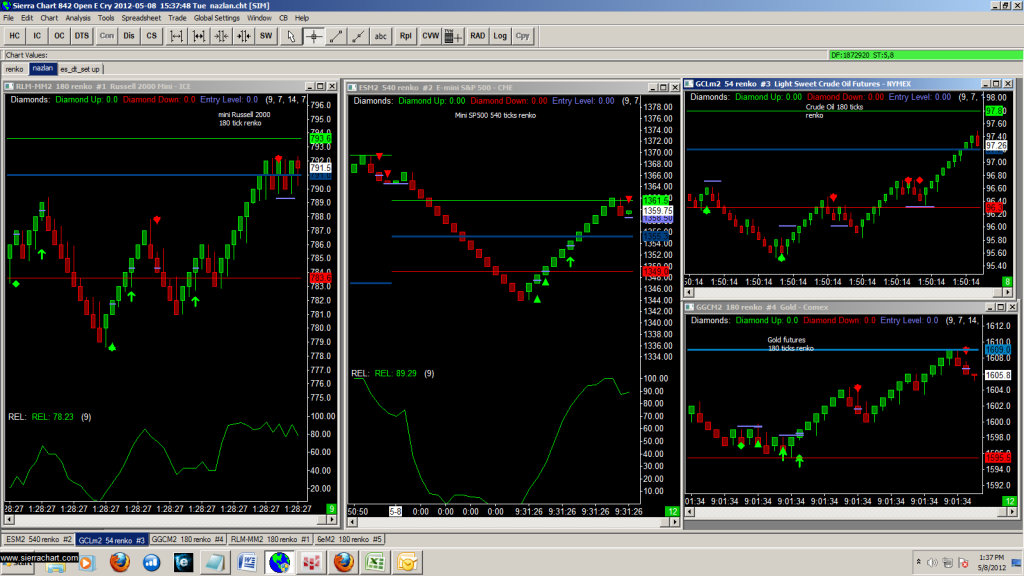
Below is a screen shot of my desktop charting from today, which I share with interested clients and prospects on a trial basis and subscription basis.

What you see below are my intra-day charts for the : ( from left to right)

Mini Russell 2000, Mini SP 500, Crude Oil ( top right), Gold futures, (bottom right)

If you have not had the trial before,


Read the rest of this entry »


Mini S&P 500 – Support and Resistance Levels

March 1st, 2012 Filed under Commodity Trading, Future Trading News | Comment (0)

Jump to a section in this post:
1. Market Commentary
2. Support and Resistance Levels – S&P, Nasdaq, Dow Jones, Russell 2000
3. Support and Resistance Levels – Gold, Euro, Crude Oil, T-Bonds
4. Support and Resistance Levels – March Corn, March Wheat, Jan Beans, March Silver
5.Economic Report for March 1, 2012

Happy Leap Day!

Hello Traders,

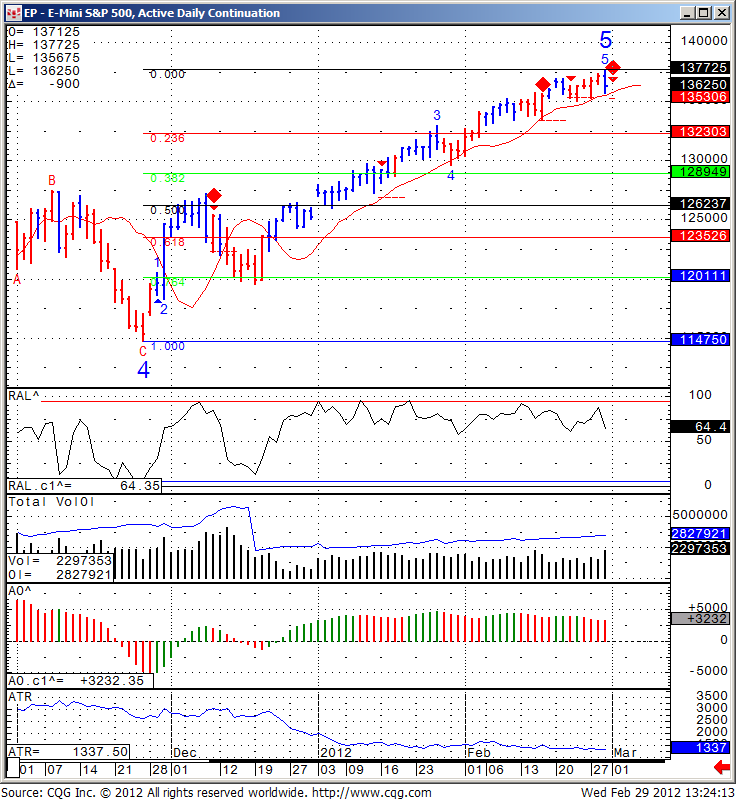
Daily chart of the Mini SP500 for your review below.

After more than a few narrow trading sessions on relatively low volume, we had a small reversal and breakout to the down side on above than avg. volume.

I would look to be a seller as a swing trading idea if the market breaks below 1356.

My recommended stop would be 1379.00 and my initial target would be 1323 followed by 1289.

Of course this is just my opinion using technical analysis and each trader should make their own trading decision based on their risk tolerance and their own judgment but I thought I would share it with the blog readers.

Daily chart of the Mini SP500

Daily chart of the Mini SP500

Read the rest of this entry »


Monthly, Weekly and Daily mini SP 500 | Support and Resistance Levels

January 31st, 2012 Filed under Commodity Trading, Future Trading News, Futures Trading | Comment (0)

Jump to a section in this post:
1. Market Commentary
2. Support and Resistance Levels – S&P, Nasdaq, Dow Jones, Russell 2000
3. Support and Resistance Levels – Gold, Euro, Crude Oil, T-Bonds
4. Support and Resistance Levels – March Corn, March Wheat, Jan Beans, March Silver
5.Economic Report for February 1, 2012

1. Market Commentary

New month is starting and I would like to wish everyone great trading in February.

As the new month starting, I am sharing 3 different charts with you, Monthly, weekly and daily of the mini SP 500.

EP - E- mini S&P 500, Monthly Continuation

EP – E- mini S&P 500, Monthly Continuation


EP - E- mini S&P 500, Monthly Continuation

EP – E- mini S&P 500, Monthly Continuation

Regardless if you are day-trading or position trading, sometimes traders can get a better prospective by looking at larger time frames and going down.

EP - E- mini S&P 500, Equalized Active Daily Continuation

EP – E- mini S&P 500, Equalized Active Daily Continuation

Would you like to have access to my DIAMOND ALGO as shown above and be able to apply for any market and any time frame on your own PC ? You can now have a two weeks free trial where I enable the ALGO along with few studies for your own sierra/ ATcharts.

If so, please send me an email with the following information:

1. Are you currently trading futures?
2. Charting software you use?
3. If you use sierra or ATcharts, please let me know the user name so I can enable you
4. Markets you currently trading?

Read the rest of this entry »


E-Mini S&P 500 – Support and Resistance Levels

January 25th, 2012 Filed under Future Trading News | Comment (0)

Jump to a section in this post:
1. Market Commentary
2. Support and Resistance Levels – S&P, Nasdaq, Dow Jones, Russell 2000
3. Support and Resistance Levels – Gold, Euro, Crude Oil, T-Bonds
4. Support and Resistance Levels – March Corn, March Wheat, Jan Beans, March Silver
5.Economic Report for January 26, 2012

1. Market Commentary

FOMC is behind us and below you will find some commentary from WSJ online as well as my daily chart of the Mini SP 500, which like always have at least two scenarios…upside possible targets as well as reversal zones if the market losses momentum..While I think this market may be overbought, I would not look to fight this momentum unless I see signs of buying exhaustion and reversal.
************************************************************
WSJ BLOG/MarketBeat: Today Looks a Lot Like a QE Trade
01/25/12 14:32

(This story has been posted on The Wall Street Journal Online’s Market Beat blog at http://blogs.wsj.com/marketbeat.)

By Min Zeng
US stocks and gold are bouncing, the ten-year Treasury yield is tumbling below 2% again (at least briefly) and the dollar is getting hit — sounds like the typical picture of a QE trade rippling through the financial markets.
Indeed, some market participants are taking today’s dovish FOMC statement as QE-lite.
The key boost for risky assets lies in the Fed’s further extension of its promise to keep its ultra-low target rate into late 2014. That means investors can be assured that the first rate hike won’t come until then or even later.
A bond trader says that the statement signals the Fed is more worried about deflation, which suggests more policy easing to co! me.
“They won’t use the D word but that is what they are thinking,” he says. “Expect QE3 to come.”
The dollar wilts on the dovish Fed, with the euro up 0.4% at $1.309.
Gold, another QE beneficiary, bounced from less than $1660 an ounce before the Fed’s statement to more than $1710 at last check.

EP - E- mini S&P 500, Equalized Active Daily Continuation

EP – E- mini S&P 500, Equalized Active Daily Continuation

Read the rest of this entry »

Have A Questions? Open an account Free Demo Account Free Demo Account

Question?

Valid first name is required.
Valid last name is required.
Phone number is required.
E-mail is required.
Message is required.
Phone (USA)
Phone (International)
Our Approach

You and your broker will work together to achieve your trading goals. We develop long term relationships with our clients so that we can grow and improve together.
Learn More About Choosing Cannon

Our Platforms

Please click on one of our platforms below to learn more about them, start a free demo, or open an account.
E-Futures Sierra Charts Firetip (Mac Compatible) RTrader

________
Doing Business With
See more...
Loading
Loading

Loading