Support & Resistance Levels

This Blog provides futures market outlook for different commodities and futures trading markets, mostly stock index futures, as well as support and resistance levels for Crude Oil futures, Gold futures, Euro currency and others. At times the daily trading blog will include educational information about different aspects of commodity and futures trading.

Weekly Newsletter 1076: Why do Most Futures Traders Lose Money and Support and Resistance Levels for the Week Ahead

Cannon Futures Weekly Letter Issue # 1076

Dear Traders,

Like us on FaceBook!
Get Real Time updates and market alerts on Twitter!


Trading 201: Why do most futures traders lose money and how can you improve your odds?

Watch the 45-minute recorded webinar where Ilan shared some of his observations of why a large percentage of traders lose money trading futures.
*Reasons why most traders lose
*Looking at tools you can utilize and improve your odds
*Review different methods/concepts of trading
*Ilan shares many tidbits that can help variety of traders
*Ilan answers questions

Thanksgiving 2021 Holiday Schedule for CME / Globex and ICE Exchange

Thanksgiving 2021 Holiday Schedule for CME / Globex and ICE Exchange

Good Trading

Trading Futures, Options on Futures, and retail off-exchange foreign currency transactions involves substantial risk of loss and is not suitable for all investors.  You should carefully consider whether trading is suitable for you in light of your circumstances, knowledge, and financial resources. You may lose all or more of your initial investment. Opinions, market data, and recommendations are subject to change at any time when it comes to Futures Trading.


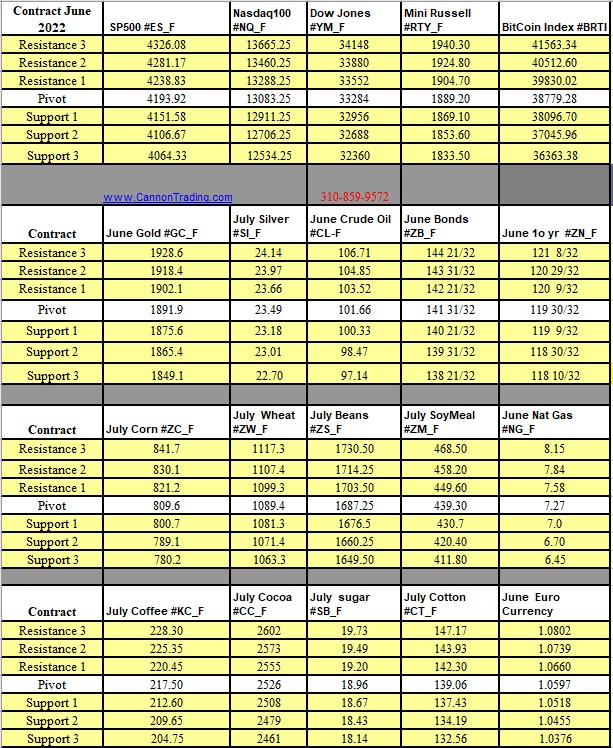
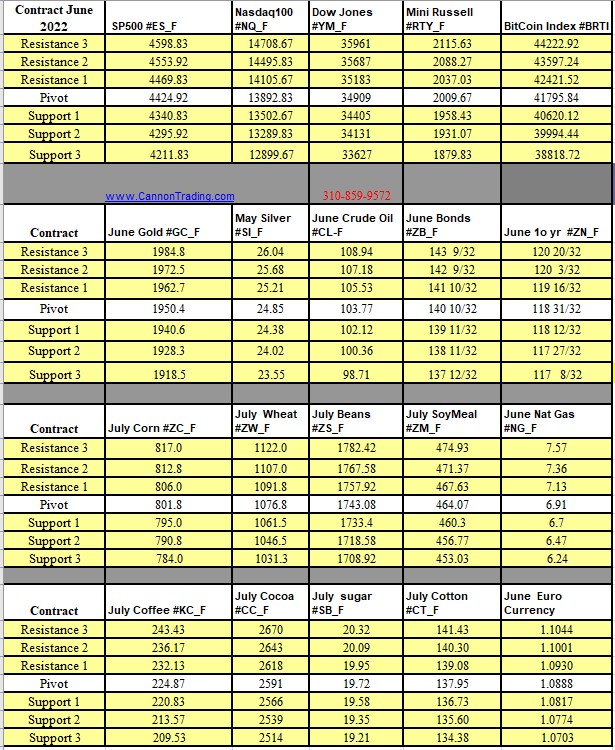
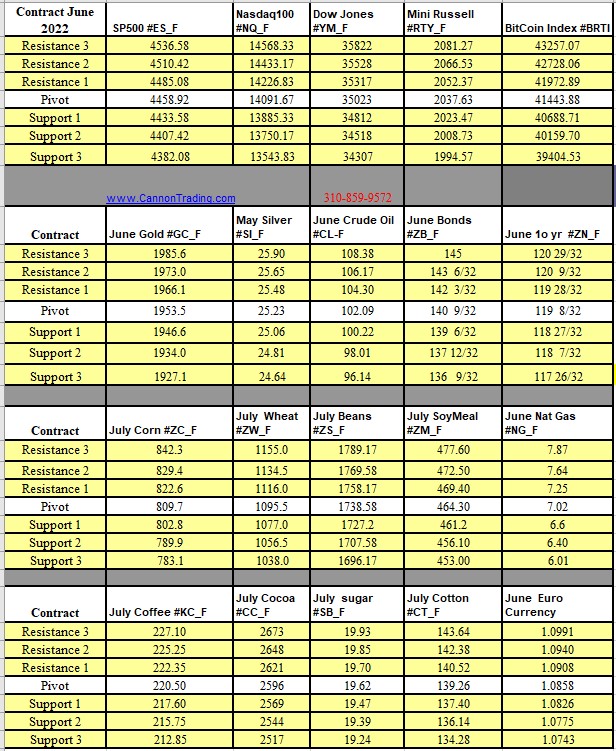
Futures Trading Levels

11-22.2021

6353dda2 85ef 435b a08c 1c0b79e18408


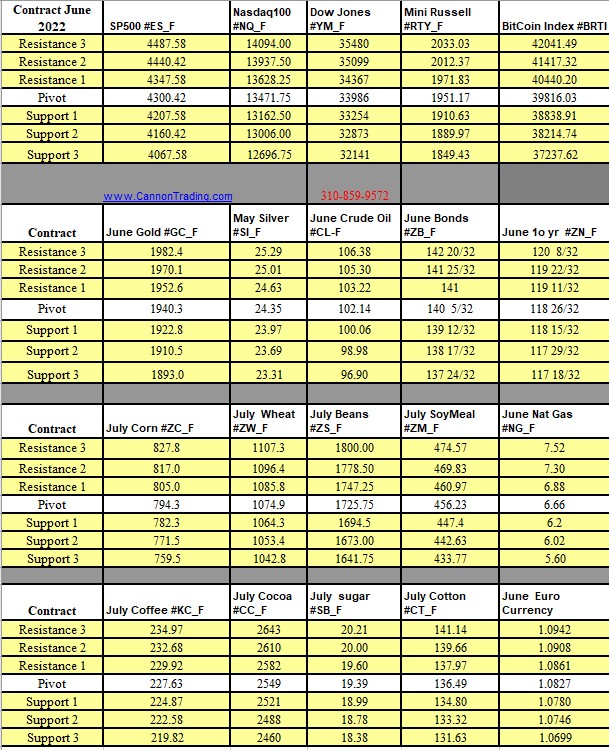
Weekly Levels

b49a35ce 992d 47d3 9a7f 5eec72d81406


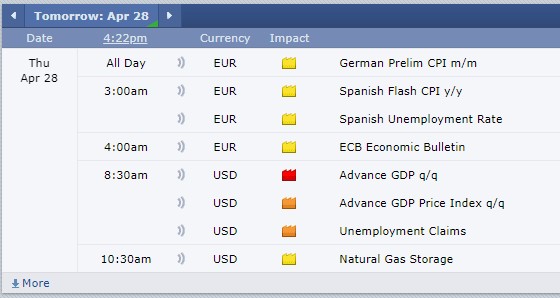
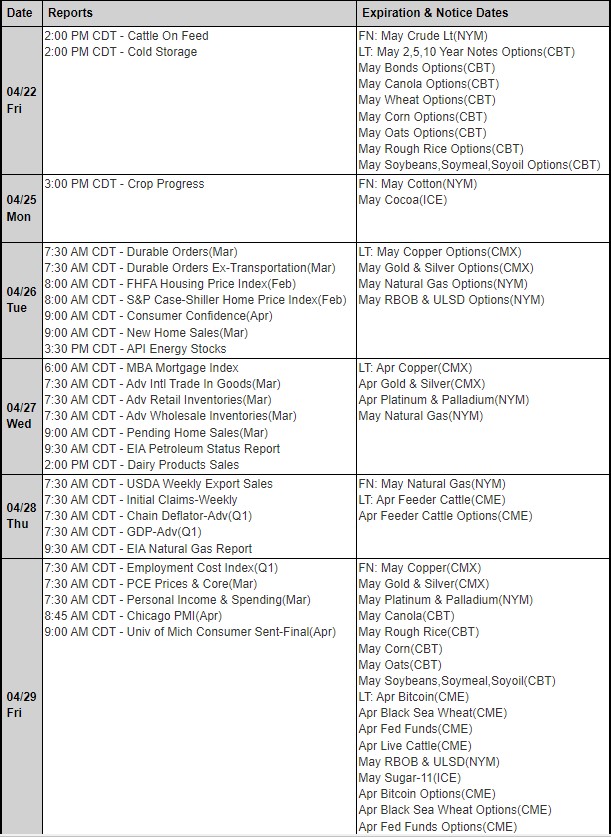
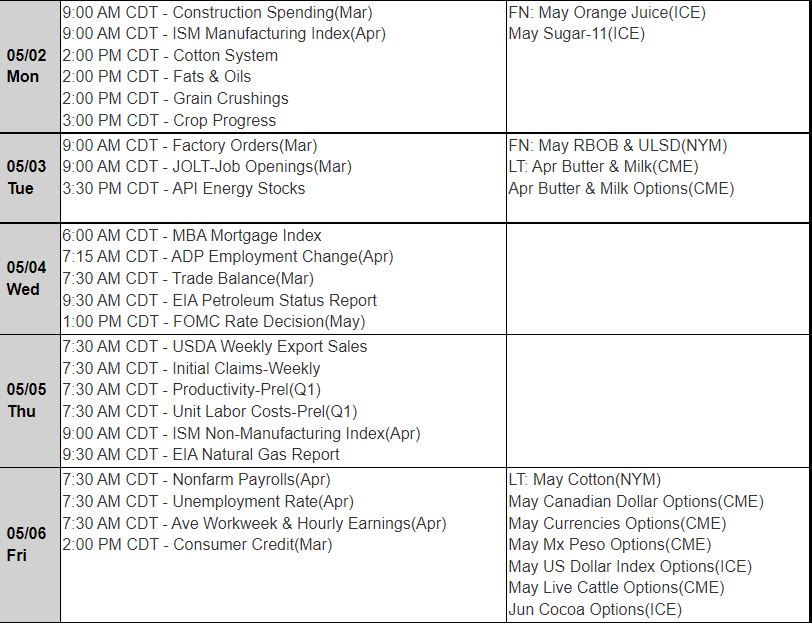
Reports, First Notice (FN), Last trading (LT) Days for the Week:

https://mrci.com

Date Reports/Expiration Notice Dates

MRCI Futures Report

This is not a solicitation of any order to buy or sell, but a current market view provided by Cannon Trading Inc. Any statement of facts here in contained are derived from sources believed to be reliable, but are not guaranteed as to accuracy, nor they purport to be complete. No responsibility is assumed with respect to any such statement or with respect to any expression of opinion herein contained. Readers are urged to exercise their own judgement in trading

Receive FRESH Insight Every Morning Before Market Open & Support and Resistance Levels 11.19.2021

Dear Futures Trader,

Get Real Time updates and more on our private FB group!

Get FRESH insight every morning BEFORE the market starts like the one below posted 3 hours before market opened this morning, on our private FB group: https://business.facebook.com/groups/1105191589938254/

XX = STOP
SCO = STOP CLOSE ONLY
MA= MOVING AVERAGE
FIBO’S = Fibonacci Retracements
11.17.21
RECAP FROM Wednesday:
THE INFLATIONARY TRADE HAS BEGUN
IN THE SOFTS:
COFFEE IS LEADING THE WAY!
H COFFEE CLOSED 234.75 +10.25!!
H SUGAR CLOSED 20.42 +0.43
H COCOA CLOSED 2568 +0.15
H COTTON CLOSED 116.92 +1.79
Z S&P
4752.00 IS THE NEXT TEST AREA.
Z S&P
4590 MUST HOLD!
CLOSE BELOW TRIGGERS 4515.00
LONG TERM
Z DOW OBJECTIVE 40,000
***
Z CRUDE COLLAPSED BELOW
KEY TRANSITIONING MA 80.07!!!
CLOSED 78.36 -2.40
BEARISH FOR S&P’S
76.26 OBJECTIVE UNTIL A CLOSE ABOVE
79.31 OCCURS.
$99.95 LONG TERM
***
Z BONDS
CLOSED 160.14 +0.14
BULLISH FOR NASDAQ
Z COPPER CLOSED
4.2660 -0.0855
BEARISH FOR S&P’S
Z YEN
CLOSED 87.64 +0.435
BEARISH FOR S&P’S
GOOD MORNING.
11.18.21 Thursday
Export Sales 7:30
Jobless Claims 7:30
EIA Gas Storage 9:30
Z US$
ALGO IS LONG
Z US$ CLOSED 95.829 -0 082
ALGO SUPPORT:
95.42
95.28 Sell SCO
95.13
Z S&P:
X 5th HIGH 4,711.75
V 01st LOW 4260.00
FIBO’S:
38.2% = 4538.75
50.0% = 4485.50
61.8% = 4432.50
4630.75
KEY MA
MUST HOLD!
4517.00
KEY TRANSITIONING MA
MASSIVE SUPPORT
4479.75
MASSIVE MA
KEY SUPPORT
4451.25
CRITICAL MA
4263.75
LAST MA SUPPORT
ALGO IS LONG
Z S&P Closed 4686.25 -9.75
ALGO SUPPORT:
4674.00
4666.50 Sell SCO
4658.25
Z NASDAQ:
X 5th HIGH 16,448.50
V 04th LOW 14,367.75
FIBO’S:
38.2% = 15,651.75
50.0% = 15,406.75
61.8% = 15,161.75
15,973.50
KEY MA
MUST HOLD!
15,471.50
KEY TRANSITIONING MA
15,359.50
MASSIVE MA
15,247.00
CRITICAL MA
14,392.50
LAST MA
ALGO IS LONG
Z NASDAQ
Closed 16,311.50 +10.75
ALGO SUPPORT:
16,228.75
16,187.50
16,142.00
Z CRUDE:
76.26 OBJECTIVE UNTIL 79.31 CLOSE.
ALGO IS SHORT
ALGO RESISTANCE:
79.62
79.09 Buy SCO
78.60
Closed $78.36 -2.40
81.84
KEY MA
KEY RESISTANCE
80.15
KEY TRANSITIONING MA
COLLAPSED ***
KEY RESISTANCE
74.17
MASSIVE MA
73.21
CRITICAL MA
67.30
LAST MA SUPPORT
Trading Futures, Options on Futures, and retail off-exchange foreign currency transactions involves substantial risk of loss and is not suitable for all investors. You should carefully consider whether trading is suitable for you in light of your circumstances, knowledge, and financial resources. You may lose all or more of your initial investment. Opinions, market data, and recommendations are subject to change at any time when it comes to Futures Trading.
If you are looking for other reference material please contact your Cannon Broker for lists of solid, informative and helpful trading tomes

Good Trading

Trading Futures, Options on Futures, and retail off-exchange foreign currency transactions involves substantial risk of loss and is not suitable for all investors.  You should carefully consider whether trading is suitable for you in light of your circumstances, knowledge, and financial resources. You may lose all or more of your initial investment. Opinions, market data, and recommendations are subject to change at any time when it comes to Futures Trading.


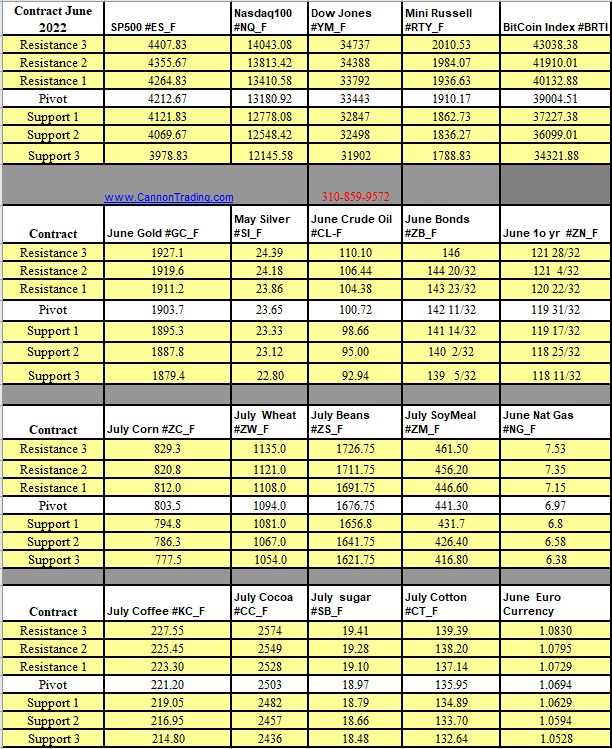
Futures Trading Levels

11-19-2021


06526eaa 17d4 48ea 958b f47834678104


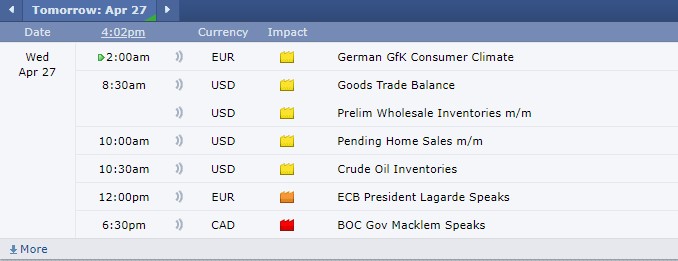
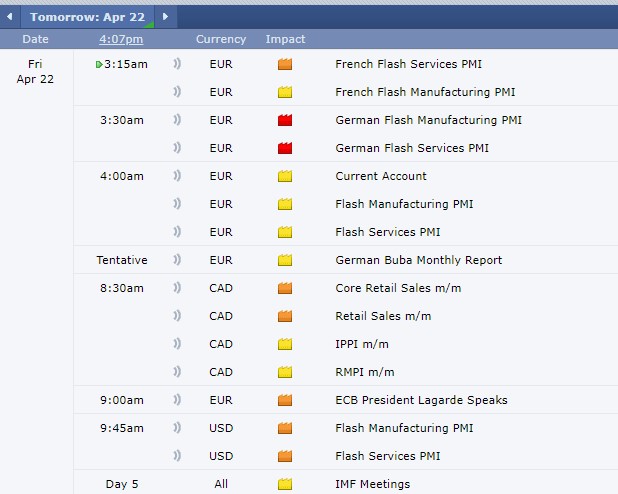
Economic Reports, source: 

https://bettertrader.co/ 

4e614f86 8add 4a85 a125 4d1e0513432e

This is not a solicitation of any order to buy or sell, but a current market view provided by Cannon Trading Inc. Any statement of facts here in contained are derived from sources believed to be reliable, but are not guaranteed as to accuracy, nor they purport to be complete. No responsibility is assumed with respect to any such statement or with respect to any expression of opinion herein contained. Readers are urged to exercise their own judgement in trading.
Crude Oil Futures Market Review and Daily Chart Analysis & Support and Resistance Levels 11.18.2021

Dear Futures Trader,

Get Real Time updates and more on our private FB group!

Crude Oil Futures Market Review and Daily Chart Analysis

Looking at both price and time FIB analysis, on the daily crude oil chart below (click here for LARGE IMAGE) I am showing a potential for crude oil to find support and have a short term reversal to the upside. I wont fight the short term trend and will look for a buy signal using 30 minute chart before I jump in front of this downward train…
What do I mean by that?
Daily chart still showing a good strength on the LONGER term scale ( see both Elliott Wave counts and trend strength). Short term we can see the strong sell of the highs made towards the end of October.
I ran both a Fibonacci retracement on prices from lows to high, as well as Fibonacci TIME retracement from the time of lows to highs to see the next TIMING window to look at.
We are getting close to a match on both time and price ( concept I was made aware of by Carolyn Boroden Strategies for Intraday Trading Fibonacci Retracements | Fibonacci Queen) so I will now look for a bullish trigger in the form of MACD cross over on the 30 minutes chart or possible turning up of RSI on the 30 minutes chart before simply trying my luck…..
As always the key will be risk and trade management if/when set up happens.
Keep in mind FRONT month for crude oil is now January! CLF22
If you are looking for other reference material please contact your Cannon Broker for lists of solid, informative and helpful trading tomes
Crude Oil Futures Daily Chart

Good Trading

Trading Futures, Options on Futures, and retail off-exchange foreign currency transactions involves substantial risk of loss and is not suitable for all investors.  You should carefully consider whether trading is suitable for you in light of your circumstances, knowledge, and financial resources. You may lose all or more of your initial investment. Opinions, market data, and recommendations are subject to change at any time when it comes to Futures Trading.


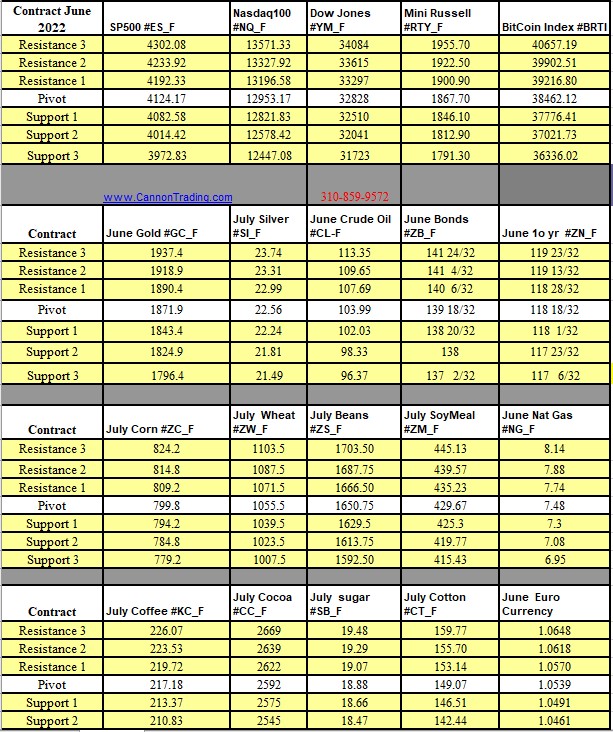
Futures Trading Levels

11-18-2021

Support and Resistance Levels 11.18.2021


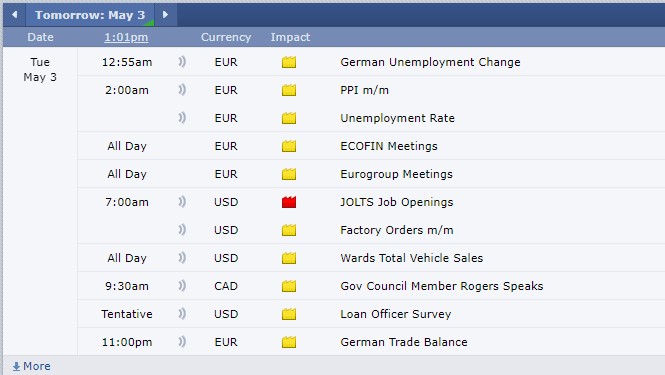
Economic Reports, source: 

https://bettertrader.co/ 

BetterTrader Economic Indicators 11.17.2021


This is not a solicitation of any order to buy or sell, but a current market view provided by Cannon Trading Inc. Any statement of facts here in contained are derived from sources believed to be reliable, but are not guaranteed as to accuracy, nor they purport to be complete. No responsibility is assumed with respect to any such statement or with respect to any expression of opinion herein contained. Readers are urged to exercise their own judgement in trading.
Natural Gas Futures Review and Chart & Support and Resistance Levels 11.17.2021

Dear Futures Trader,

Get Real Time updates and more on our private FB group!
The natural gas market has seen volatility increase sharply over the past 8 weeks. Once it broke above 4.65 in early September, the market ventured into new territory with heightened volatility.
Supply crunch across the globe along with the seasonality of entering winter contributed to the rally and the pull back.
Notice how the front, Dec. contract bounced sharply off the major support/demand area at 4.70 and is now trading against the major supply area ( red line / moving average) at 5.44.
This market can go either way and do it relatively fast. Weather, supply chain news will determine next move.
A close above 5.44 can trigger retest of $6. Failure at the same level can send market towards the 4.65.
If you are looking for other reference material please contact your Cannon Broker for lists of solid, informative and helpful trading tomes
Futures Natural Gas Daily Chart

Good Trading

Trading Futures, Options on Futures, and retail off-exchange foreign currency transactions involves substantial risk of loss and is not suitable for all investors.  You should carefully consider whether trading is suitable for you in light of your circumstances, knowledge, and financial resources. You may lose all or more of your initial investment. Opinions, market data, and recommendations are subject to change at any time when it comes to Futures Trading.


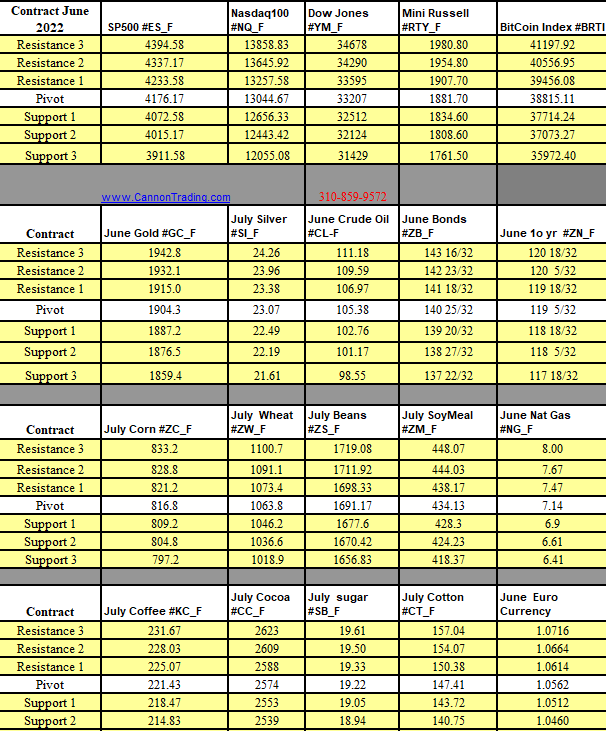
Futures Trading Levels

11-17-2021

Support and Resistance Levels 11.17.2021


Economic Reports, source: 

https://bettertrader.co/ 

Better Trader Economic Reports 11.17.2021

This is not a solicitation of any order to buy or sell, but a current market view provided by Cannon Trading Inc. Any statement of facts here in contained are derived from sources believed to be reliable, but are not guaranteed as to accuracy, nor they purport to be complete. No responsibility is assumed with respect to any such statement or with respect to any expression of opinion herein contained. Readers are urged to exercise their own judgement in trading.
Thanksgiving 2021 Holiday Schedule for CME / Globex and ICE Exchange

Thanksgiving 2021 Holiday Schedule for CME / Globex and ICE Exchange

25a9aeeb 88b8 4e19 8ad1 9cb0a9fa9041


*Dates and times are subject to change

If you have any questions, please call the CME Global Command Center at +1 800 438 8616, in Europe at +44 800 898 013 or in Asia at +65 6532 5010

Globex® Thanksgiving Day 2021 Holiday Schedule for CME / Globex and ICE Exchange

More details at: http://www.cmegroup.com/tools-information/holiday-calendar.html 

ICE Futures Thanksgiving Day 2021 Holiday Schedule for CME / Globex and ICE Exchange

Detailed holiday hours for ICE Futures: https://www.theice.com/holiday-hours

The above sources were compiled from sources believed to be reliable. Cannon Trading assumes no responsibility for any errors or omissions.  It is meant as an alert to events that may affect trading strategies and is not necessarily complete.  The closing times for certain contracts may have been rescheduled.

8 Steps to Successful Futures Trading & Support and Resistance Levels 11.16.2021

Dear Futures Trader,

Get Real Time updates and more on our private FB group!

8 Steps to Successful Futures Trading

My name is Ilan Levy-Mayer and I am the Vice President and Senior Futures Broker at Cannon Trading. I came up with the following personal observations after serving online traders worldwide for more than 21 years.
The following steps are guides to progress, and are not necessarily in sequential order. Some of them are always required, but each futures trader is different and will relate to these stages in their own ways. While attempting to learn and progress, one must keep in mind that futures trading strategies are risky and can involve significant losses.
1. Education
Hopefully if you are already trading you have completed your initial education: contract specs, trading hours, futures brokers, platforms, the opportunities as well as the risk and need to use risk capital in futures, and so on. Understanding this information is essential to good futures trading strategies. The second type of education is ongoing: learning about trading techniques, the evolution of futures markets, different trading tools, and more.
2. Find A System
I am definitely not advising you to go on the web and subscribe to a “black box” system (using buy/sell triggers if don’t know why they are being generated). What I am advising is developing a trading technique: a general set of rules and a trading concept. As you progress, you may want to put the different rules and indicators into a computerized system, but the most important factor is to have a focus and a plan. Don’t just wake up in the morning and trade “blank.”
If you are looking for other reference material please contact your Cannon Broker for lists of solid, informative and helpful trading tomes

Good Trading

Trading Futures, Options on Futures, and retail off-exchange foreign currency transactions involves substantial risk of loss and is not suitable for all investors.  You should carefully consider whether trading is suitable for you in light of your circumstances, knowledge, and financial resources. You may lose all or more of your initial investment. Opinions, market data, and recommendations are subject to change at any time when it comes to Futures Trading.


Futures Trading Levels

11-16-2021


Futures Support and Resistance Levels 11.16.2021


Economic Reports, source: 

https://bettertrader.co/ 

BetterTrader Economic Indicators


This is not a solicitation of any order to buy or sell, but a current market view provided by Cannon Trading Inc. Any statement of facts here in contained are derived from sources believed to be reliable, but are not guaranteed as to accuracy, nor they purport to be complete. No responsibility is assumed with respect to any such statement or with respect to any expression of opinion herein contained. Readers are urged to exercise their own judgement in trading.

Weekly Newsletter 1075: Trading Videos – Indicators used for Trailing Stops & Exits? & Support and Resistance Levels for the Week Ahead

Cannon Futures Weekly Letter Issue # 1075

Dear Traders,

Like us on FaceBook!
Get Real Time updates and market alerts on Twitter!


Trading Videos 101: Curious on an indicator that can help you with EXITS? How about using a certain indicator as a trailing stop?

Watch the latest trading videos we have posted and see if you can pick a tip or two on trading smarter!

In this week’s newsletter we are sharing four videos, each a few minutes long. The videos discuss practical tips for trading and sharing our experience with you

1. Using Bolinger Bands as a possible tool for exiting trades

2. One way you can use the Parabolics study ( also known as PSAR) to manage current positions, possibly as a trailing stop

3. Different ways traders can utilize support and resistance levels in their trading.

4. Entering trades on a stop, using “price confirmation”.

5. Utilizing Range Bar charts for shorter term trading as a way to try and filter out some noise.

Watch the videos instantly by clicking here

Good Trading

Trading Futures, Options on Futures, and retail off-exchange foreign currency transactions involves substantial risk of loss and is not suitable for all investors.  You should carefully consider whether trading is suitable for you in light of your circumstances, knowledge, and financial resources. You may lose all or more of your initial investment. Opinions, market data, and recommendations are subject to change at any time when it comes to Futures Trading.


Futures Trading Levels

11-15.2021

Futures Support and Resistance Levels 11.15.2021


Weekly Levels

Weekly Futures Support and Resistance Levels


Reports, First Notice (FN), Last trading (LT) Days for the Week:

https://mrci.com

Date Reports/Expiration Notice Dates

MRCI Weekly Reports

This is not a solicitation of any order to buy or sell, but a current market view provided by Cannon Trading Inc. Any statement of facts here in contained are derived from sources believed to be reliable, but are not guaranteed as to accuracy, nor they purport to be complete. No responsibility is assumed with respect to any such statement or with respect to any expression of opinion herein contained. Readers are urged to exercise their own judgement in trading

3 Main Types of Trading Days, 30 Year Bond Chart Review & Support and Resistance Levels 11.12.2021

Dear Futures Trader,

Get Real Time updates and more on our private FB group!
Yesterday we had a nice volatile day, with price action both up and down and then we followed it today ( Veteran’s Day, banks are closed) with very choppy, much narrower price action. Tomorrow is Friday, after a quiet day and with some meanigful reports – which encouraged me to share the following with you on the different types of trading days:

 In my opinion there are 3 main types of trading days:

1. The most common day are two sided trading action with swings up and down – this type of trading day is most suitable for using support and resistance levels along with overbought/oversold indicators.
2. Strong trending days, mostly one directional – this type of trading day is the least common, many times will happen on Mondays and maybe 3-5 times a month at most – this type of trading day is most suitable for using ADX, MACD crossovers and pretty much looking for pullbacks to jump on the trend perhaps with the help of parabolics.
3. Slow and/or choppy trading days – this type of trading day is best suited for taking small profits from the market by looking at volume spikes, using stochastics as possible entry signals and usually wait for a pullback before jumping in.
·A good question I’ve been asked is how can one asses what type of trading day we will have while the market is still trading….I have been doing some work in finding the answers and will be happy to hear feedback via email but here are some initial observations:
1.  Was the overnight session a wide, two sided trading range? If the answer is yes, good chances for similar trading day during the primary session (primary session is when the cash/stock market is open)
2. Mondays have the highest chance for trending days
3. The behavior of the first hour of trading can also suggests the type of action for the rest of the day.
4. If the first 30 minutes of the trading day have good volume, better chances for type 1 or type 2 trading days.
5. Low volume during the first 30 minutes can suggest a choppy (type 3 trading day)
6. Are there other strong trends in other sectors? ( bonds? metals? energies? Dollar index? )
Trading Futures, Options on Futures, and retail off-exchange foreign currency transactions involves substantial risk of loss and is not suitable for all investors. You should carefully consider whether trading is suitable for you in light of your circumstances, knowledge, and financial resources. You may lose all or more of your initial investment. Opinions, market data, and recommendations are subject to change at any time when it comes to Futures Trading.
Hourly/ 60 minutes chart click for larger image) of the 30 yr bonds (ZB or USA) for your review below. I have heard from some clients that they “like the personality of the bonds” better than the ES and NQ. Different dynamics, larger tick size – may be worth your time to follow and try in SIM MODE first
Futures US Treasury Bond 60 minute Chart
If you are looking for other reference material please contact your Cannon Broker for lists of solid, informative and helpful trading tomes

Good Trading

Trading Futures, Options on Futures, and retail off-exchange foreign currency transactions involves substantial risk of loss and is not suitable for all investors.  You should carefully consider whether trading is suitable for you in light of your circumstances, knowledge, and financial resources. You may lose all or more of your initial investment. Opinions, market data, and recommendations are subject to change at any time when it comes to Futures Trading.


Futures Trading Levels

11-12-2021


Futures Support and Resistance Levels 11.12.2021


Economic Reports, source: 

https://bettertrader.co/ 

BetterTrader Reports


This is not a solicitation of any order to buy or sell, but a current market view provided by Cannon Trading Inc. Any statement of facts here in contained are derived from sources believed to be reliable, but are not guaranteed as to accuracy, nor they purport to be complete. No responsibility is assumed with respect to any such statement or with respect to any expression of opinion herein contained. Readers are urged to exercise their own judgement in trading.
Get An Edge With the Trading Psychology Course, Gold Chart Review & Support and Resistance Levels 11.11.2021

Dear Futures Trader,

Get Real Time updates and more on our private FB group!

Get An Edge With the Trading Psychology Course

“You Must Understand That There Is More Than One Path To The Top Of The Mountain.”- Miyamoto Musashi, A Book Of Five Rings: The Classic Guide To Strategy
Many experienced traders say that the stiffest challenge you’ll face in becoming a futures trader is conquering your own psyche. Why? Because losing is part of trading, and people hate to lose.
In this “Trading Psychology” Course you will learn:
·    How to examine your patterns and behaviors and recognize when they are holding you back
·    Maintaining self-confidence as a trader even in the face of inexperience
·    The mathematical expectation model and how it can decrease your losses
·    Determining the trading plan that is right for your trading personality
·    Understanding and using Motivation – Risk – Reward to its full advantage
·    Creating effective trading technique strategies
·    Qualities of Successful Traders
Futures Gold Daily Chart

Good Trading

Trading Futures, Options on Futures, and retail off-exchange foreign currency transactions involves substantial risk of loss and is not suitable for all investors.  You should carefully consider whether trading is suitable for you in light of your circumstances, knowledge, and financial resources. You may lose all or more of your initial investment. Opinions, market data, and recommendations are subject to change at any time when it comes to Futures Trading.


Futures Trading Levels

11-11-2021


Futures Trading Support and Resistance Levels 11.11.2021


Economic Reports, source: 

https://bettertrader.co/ 

BetterTrader Economic Indicators 11.11.21


This is not a solicitation of any order to buy or sell, but a current market view provided by Cannon Trading Inc. Any statement of facts here in contained are derived from sources believed to be reliable, but are not guaranteed as to accuracy, nor they purport to be complete. No responsibility is assumed with respect to any such statement or with respect to any expression of opinion herein contained. Readers are urged to exercise their own judgement in trading.

Gold Futures Outlook/ Chart Review & Support and Resistance Levels 11.10.2021

Dear Futures Trader,

Get Real Time updates and more on our private FB group!

Daily chart of gold futures below for your review.

Notice a few recent TECHNICAL buy signals appeared on the daily chart.
Inflation fears are also a factor but Bitcoin seems to compete with gold for attention.
The gold market experienced good amount of selling between 1835 and 1841 during the last few months, a break above it can trigger another leg higher, failure will send this market to being the range bound it has these past few months.
If you are looking at longer term trades, MICRO gold is a good, smaller size alternative.
Some traders like to use combination of futures and options, example long the futures, selling a call on rallies and using the premium to buy puts in case of a pullback. Many ways to lose money in the trading world and very few to try and profit…..
Knowing your risk is the first step, managing your risk is the 2nd step. Evaluating the trade, positions and market dynamics is an ongoing process.
Gold Futures Chart 11.10.2021

Good Trading

Trading Futures, Options on Futures, and retail off-exchange foreign currency transactions involves substantial risk of loss and is not suitable for all investors.  You should carefully consider whether trading is suitable for you in light of your circumstances, knowledge, and financial resources. You may lose all or more of your initial investment. Opinions, market data, and recommendations are subject to change at any time when it comes to Futures Trading.


Futures Trading Levels

11-10-2021

Futures Support and Resistance Levels 11.10.2021


Economic Reports, source: 

https://bettertrader.co/ 

8cb377fe 0994 433b a3ea 2fa87e92542b


This is not a solicitation of any order to buy or sell, but a current market view provided by Cannon Trading Inc. Any statement of facts here in contained are derived from sources believed to be reliable, but are not guaranteed as to accuracy, nor they purport to be complete. No responsibility is assumed with respect to any such statement or with respect to any expression of opinion herein contained. Readers are urged to exercise their own judgement in trading.