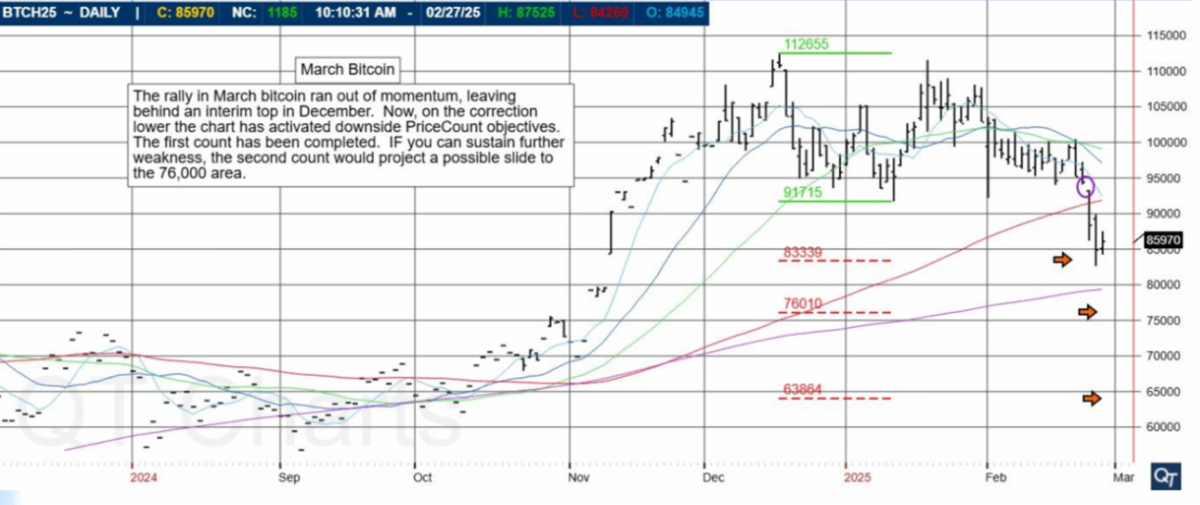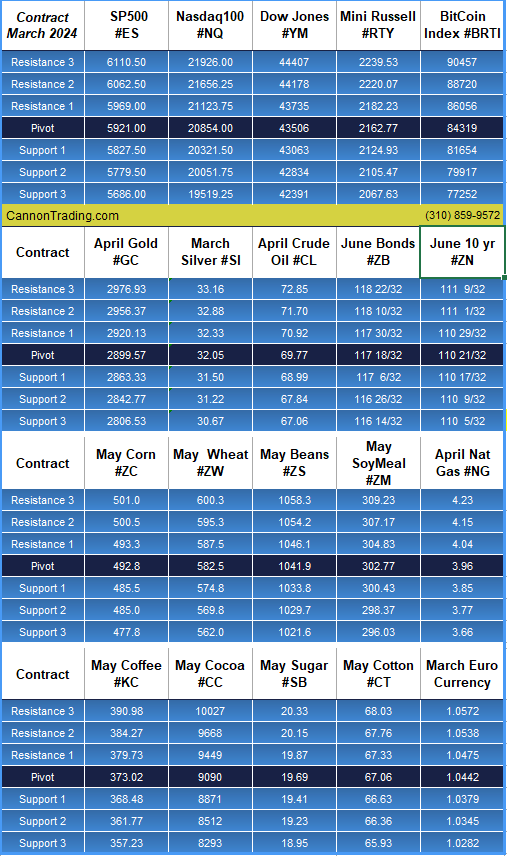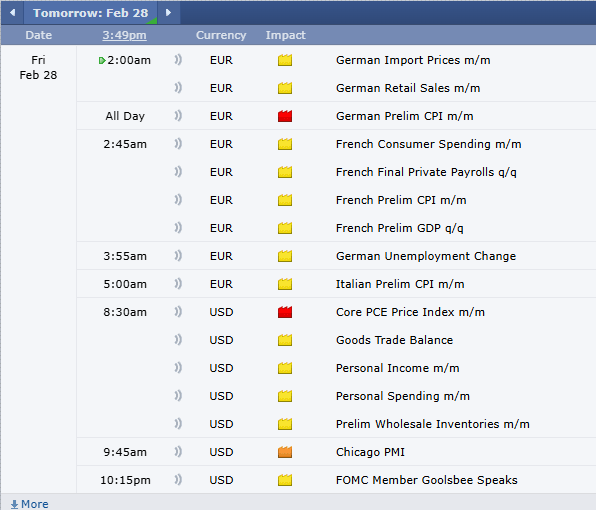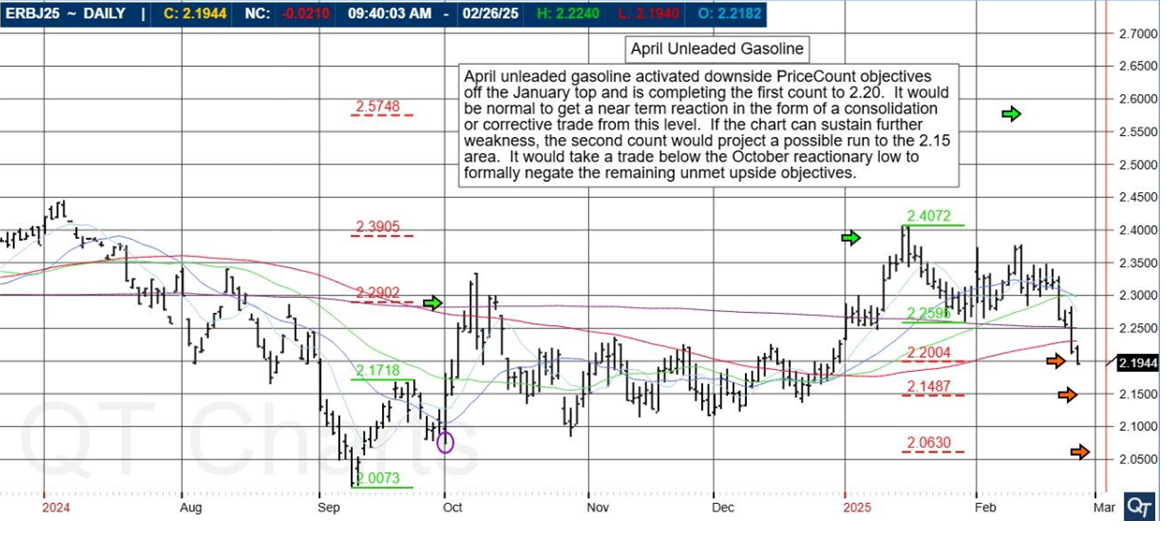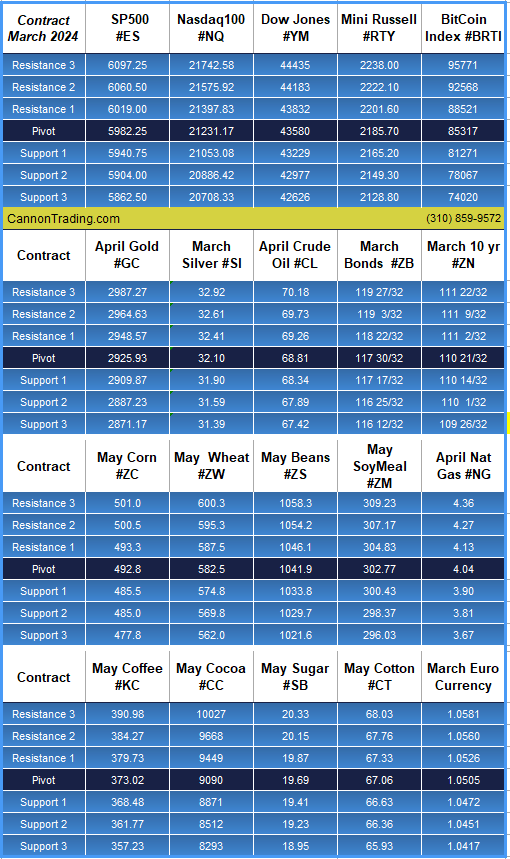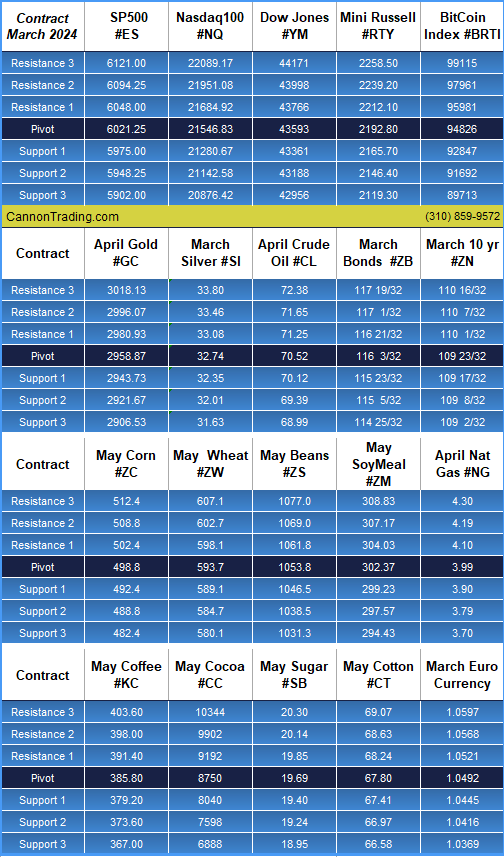
Support & Resistance Levels

This Blog provides futures market outlook for different commodities and futures trading markets, mostly stock index futures, as well as support and resistance levels for Crude Oil futures, Gold futures, Euro currency and others. At times the daily trading blog will include educational information about different aspects of commodity and futures trading.

Market Movers: Precious Metals Surge, Dollar Slides, and New Home Sales September 25th 2024

Get Real Time updates and more by joining our Private Facebook Group!

Subscribe to our YouTube Channel

Listen to our Market Recap Podcasts on Apple Podcasts


C65


Movers and Shakers

By John Thorpe, Senior Broker   With Equities quietly trading in a consolidation phase, Interest rates following, the precious metals ,once again found footing and surprised many traders with their mid-day upside move, Gold higher by $36.00 @ 2689.00, Silver up $1.50 into the $32.50 /Troy OZ range..  The US Dollar @ 100.10 continuing it’s 2.5 month long slide, flirting with 14 month lows of 99.22. Metals should gain additional strength if the dollar falls below that number on a closing basis.   Todays Headlines   Updated: September 24, 2024 6:12 am Churning hurricane threatening US production, continued Middle East tensions, and Chinese stimulus measures have helped crude oil prices trade higher on Tuesday.   Updated: September 24, 2024 7:00 am China’s central bank announced its largest stimulus measures since the pandemic. The bank will lower interest rates and additional funding. However, analysts say very week consumer and business demand for credit will have little response to lower interest rates, and the lack of fiscal stimulus measures will leave the central bank’s response to fall short of jump starting the economy and beating back deflationary environment.   Updated: September 24, 2024 7:55 am Redbook Weekly US Retail Sales Headline Recap   **Redbook Weekly US Retail Sales were +5.2% in the first three weeks of September 2024 vs September 2023 **Redbook Weekly US Retail Sales were +4.4% in the week ending September 21 vs yr ago week   Updated: September 24, 2024 8:00 am Case Schiller 20 US Metro-Area Home Prices Recap   **Case Schiller 20 US metro area home prices for July Y/Y: +5.9% from the year ago month **Case Schiller 20 US metro area home prices for July M/M: +0.01% vs prior month   Updated: September 24, 2024 9:02 am Richmond Fed Manufacturing Index Headline Recap   **Richmond Fed September Manufacturing Index: -21.0 ; prior -19.0 **Richmond Fed September Manufacturing Shipments Index: -18.0 ; prior -15.0 **Richmond Fed September Manufacturing New Orders: -23.0 ; prior -26.0 **Richmond Fed September Manufacturing Employees: -22.0 ; prior -15.0 **Richmond Fed September Manufacturing Prices Paid: +3.36 ; prior +2.45 **Richmond Fed September Manufacturing Prices Received: +1.57 ; prior +1.87   **Richmond Fed September Service Sector Index:-1.0 ; prior -11.0 Updated: September 24, 2024 9:09 am Conference Board Consumer Confidence, Present Situation, Expectations Index Headline Recap   **Conference Board September Consumer Confidence Index: 98.7 ; prior revised to 105.6 from 103.3 ; expected 102.8 **Conference Board September Consumer Present Situation Index: 124.3 ; prior revised to 134.6 from 134.4 **Conference Board September Consumer Expectations Index: 81.7 ; prior revised to 86.3 from 82.5   Tomorrows Movers and Shakers New Home Sales Released On 9/25/2024 10:00:00 AM For Aug, 2024   d5630393 2c73 4ce0 b0be 7493161efe7b   US new home sales data for June will be updated Wednesday morning at 9:00 am CT. Analysts expect new home sales month-to-month at a 0.640 mln unit annualized pace, up +3.4%. The prior month’s sales were -11.3% at 0.619 mln unit annual rate.   Micron Technology reports after the close  

stars


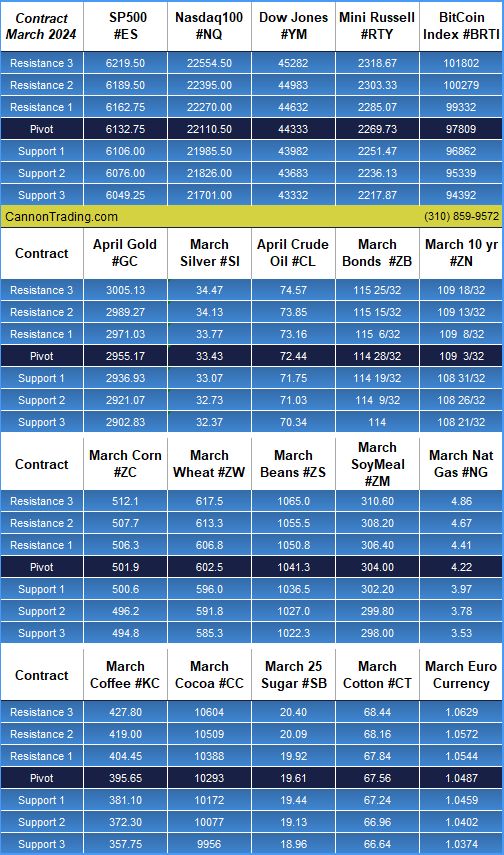
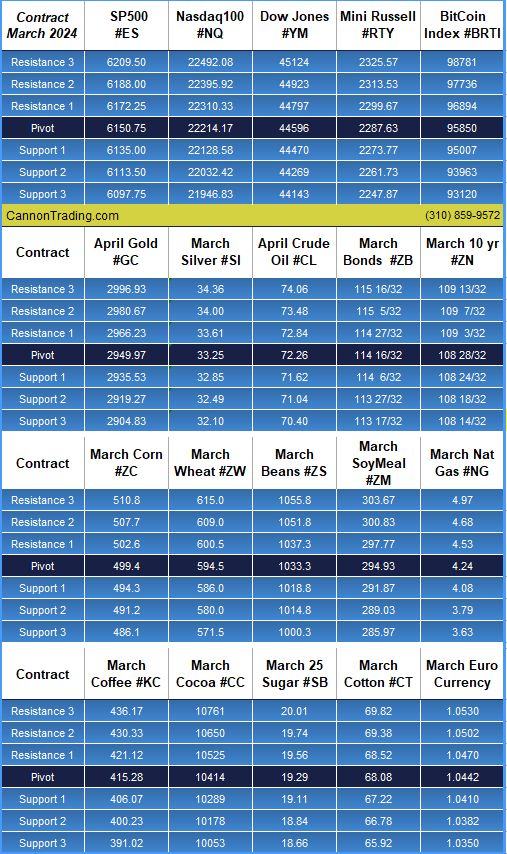
Daily Levels for September 25, 2024


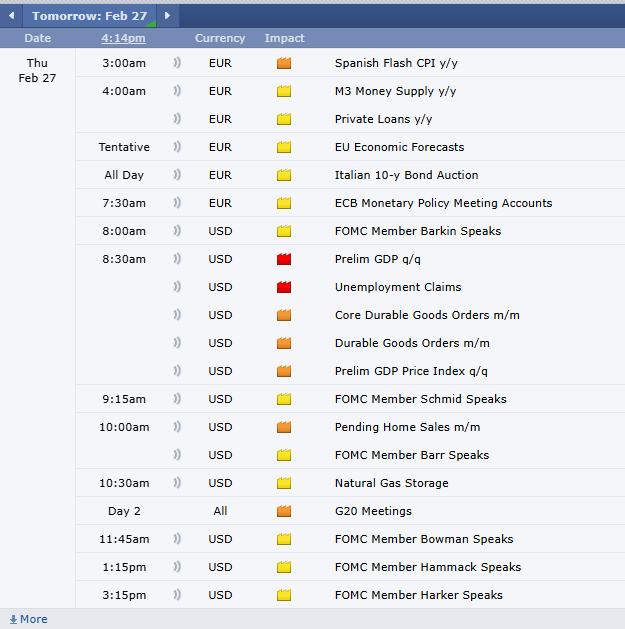
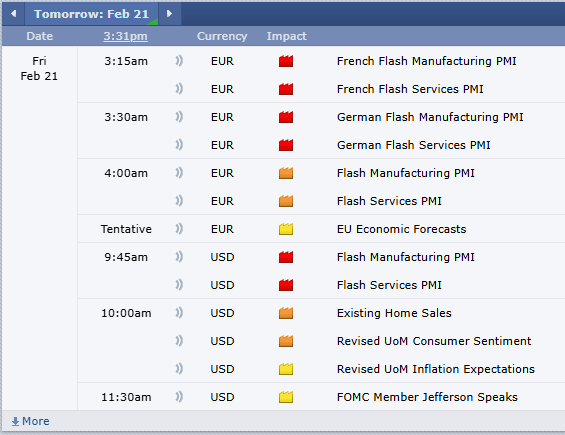
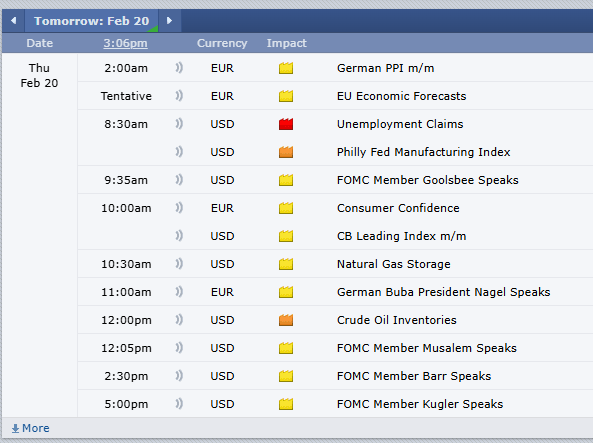
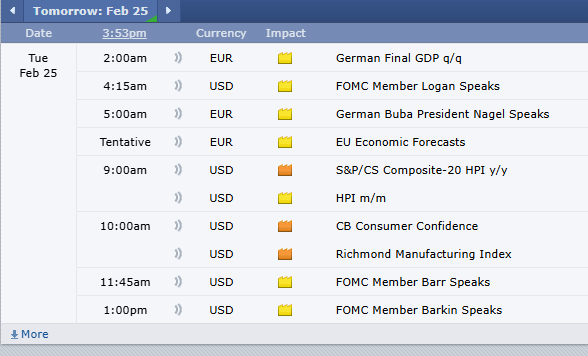
Economic Reports

provided by: ForexFactory.com

All times are Eastern Time ( New York)
ee47eb0e affe 407f b7b1 18190dc7ce36

Improve Your Trading Skills

Get access to proprietary indicators and trading methods, consult with an experienced broker at 1-800-454-9572.

Explore trading methods. Register Here

3b644da2 2bee 4d39 8d98 5208a20bec39

* This is not a solicitation of any order to buy or sell, but a current market view provided by Cannon Trading Inc. Any statement of facts here in contained are derived from sources believed to be reliable, but are not guaranteed as to accuracy, nor they purport to be complete. No responsibility is assumed with respect to any such statement or with respect to any expression of opinion herein contained. Readers are urged to exercise their own judgement in trading.


#Equities, #Consolidation phase, #Interest rates, #Precious metals, #Gold, #Silver, #US Dollar, #Crude oil prices, #HurricaneHelene, #Middle East tensions, #Chinese stimulus, #Redbook US Retail Sales, #Case Schiller US Metro-Area Home Prices, #Richmond Fed Manufacturing Index, #Service Sector Index, #Consumer Confidence, #New Home Sales, #Micron Technology

How a Commodities Broker Can Help You Diversify Your Investment Portfolio

If you’re active in the stock market and know how to trade and sell to make money then your next step in getting the most out of companies and securities is to find a commodities broker to trade commodity contracts on your behalf, no matter how active traders are using commodity futures. You can find a broker to do the trading on your behalf or get access to trading platforms and advanced tools that let you become a commodity trader on your own. You can turn a profit out of any commodities markets when you have industry at your fingertips and you won’t have to pay massive exchange fees or increase your risk exposure.

If you go with a commodities broker, you’ll have the advantage of all the trading experience he or she has and they’ll ensure that your assets provide derivatives that make you money while they’re executing trades on your behalf. Suppose you prefer to carry out the business of futures trading and futures contracts on your own. In that case, you’ll have access to all exchanges through trading platforms built by experienced traders and investors. There’s no easier way to trade and make a profit in the market and commodities brokers from all over the industry will be there to help you make the right decisions.

Understanding Commodities and Commodity Brokers

To understand what a commodities broker does, you have to understand what a commodity is and it’s not difficult, once you understand that it’s a physical good, unlike stocks or bonds that most people trade. You can think of commodities as precious metals such as gold, energy like crude oil, and foods such as soybeans, corn, and grain. Each one of those has a price and you’ll typically be trading their futures, as opposed to trading the price of grain don’t the day you make the exchange.

People who trade commodities are well-versed in futures markets and have an idea of where the price of something will be on the day the trades are made in the future, meaning your trader is the best source of information on the market. For instance, you likely don’t know what will happen to gold on the London metal exchange. Hence, commodity brokers are best to negotiate commodity contracts on your behalf so you make the most profit off your investment. No matter how many trades you want to exchange with other investors, you’ll have a steady flow of derivatives that your commodity trader or commodities broker gets for you.

Key Characteristics of a Good Commodity Broker

Man Studying Graphs

There are a few things to look for in a good commodities broker or commodity trader and the first is that they have lots of educational trader material for their clients to check out so they know what the commodity broker is doing and they’re they’re doing it on their behalf. They should also let their clients make trades on their own without charging exorbitant fees that cut into their derivatives so much they struggle to make money off the markets. While trading commodities will come with fees, they should be fair so everyone from the trader to the brokers benefits from it.

Your commodities broker or trader should give you access to futures trading that you can’t get on your own so you find plenty of value in what they have to offer you while you make your way through the exchanges on their platform. Every trader should have access to educational material to learn what futures trading is and how futures commission merchants fit into the business before they decide to buy their first commodity. Commodities brokers should also be regulated by the National Futures Association, so you can be sure that all commodities and futures are being traded the way they’re supposed to be.

What to Look for in a Commodities Trading Platform

When you want to act as your own trader, instead of commodity brokers trading on your behalf, it’s just as important to check out any platform you’re considering to ensure they’re adhering to National Futures Association rules and that you’ll have access to all the trader information as a broker. It’s a very good idea to seek out a platform that offers the assistance of a commodity broker who doesn’t act as your trader but gives you advice on the futures to buy and sell. This is a well-rounded and balanced approach that leaves you in charge of the final trader decisions while the brokers simply offer you input.

The platform should also have plenty of graphs that you can use to follow the course of the commodity and make an informed guess on where it will be in the future when your trader moves are carried out in the markets. Any commodity broker will tell you that information is their main source of power and that’s what you need to get from the platform you choose to use. It’s the best way to know that your portfolio management choices are sound and that you’ll be making better choices for you than brokers would.

Security and Safety

Silver Bars

Finally, whether you choose to let a commodity broker be your trader, or if you’re making the decisions on your own, the platform you use should put your safety and security about everything else they have to offer you, especially since you’re dealing with your livelihood and the derivatives you’ve worked so hard to make. It doesn’t matter which commodity you want to invest in on the trader platform, your information should always be kept safe and secure on the site and your broker should always let you know exactly what’s happening with your capital.

It’s also important to have access to live trader and commodity news on the platform so you can make informed decisions about everything you choose to do as your own broker. The best commodity platform will have plenty of up-to-date information for you to study or glance at to know what’s happening and what’s coming in the market. Once you find a trader platform with all that, you’ll have everything you need to be the best broker you can be.

What to Watch for After a Fed Rate Cut: Market Reactions, Opportunities, and Risks

Get Real Time updates and more by joining our Private Facebook Group! Subscribe to our YouTube Channel Listen to our Market Recap Podcasts on Apple Podcasts
C79

What to look out for after a FED rate cut

September 23, 2024 by GalTrades.com Powel said at the Jackson hole meeting, “The time has come for policy to adjust,” The direction of travel is clear, and the timing and pace of rate cuts will depend on incoming data, the evolving outlook and the balance of risks.” It didn’t matter if we got a .25 or .50 basis point rate cut, earnings growth will determine if the market can keep going up. The market made new all-time highs, but only one MAG7 stock made new all-time high, META. That means the rally is broadening, a positive point for the market. The S&P is currently trading at a forward P/E of 21 which suggests that a lot has been priced regarding the bull thesis. Valuations are high and that should be noted. How much higher can the market go up? remains to be seen. “don’t fight the Fed” or “don’t fight the trend” are statements to sustain near-term bullish momentum. Aside from the FED cutting rates, the economy still appears to be on firm footing. Next week the earnings and economic calendar is relatively light, outside of next Friday’s PCE report, but perhaps this can be conducive for recent bullish momentum. In the absence of news, the path of least resistance is higher. Yes, we are still in the midst of bearish seasonality, but the technicals look encouraging. Going forward bad news is good news because the FED will need to lower rates on bad news, unless the news is disastrous. As long as the SPX can remain above July’s prior all-time closing high 5,667, we should see continuation. An SPX close below 5,667 could introduce concerns of a false breakout to all-time highs, which would likely introduce some additional selling pressure A positive point: 76% of the S&P 500 stocks are above there 50 Day Moving Averages and 76% are above their 200 Day MA. Year to date the two top performing factors were momentum and growth which were up 29/27 % respectively. The two worst preforming groups were yield and value stocks. In the last 3 month that flipped. Dividend and value stocks get an uptick when rates come down. I see analysts calling for the small caps to go up with rate cuts. The action on Wednesday didn’t show that. It may be wise to react as opposed to jumping in now. It would make more sense for mid-caps to go up prior to small caps as there are more profitable companies in mid-cap sectors. Statistics show post-election the markets usually end higher. And in the past when the FED has cut rates in a soft landing, or no landing markets ended up higher for the next 6 to 12 months almost 100% of the time. Cyclical, mortgage, auto loan rates and small cap stand to benefit from rate cuts. Rate cuts can ignite small caps and value stocks. The IJR index contains a higher % of companies which are profitable as opposed to the IWM Russell 2000. Bull market indicators usually benefit capital market plays, stocks such as; CBOE, IBKR, BLK, GS. Rate cuts should help the homebuilders XHB ETF. If Fed rate cuts can bring short-end bond yields down to more normal rates, then banks wouldn’t have to overcompensate at the long end and longer-term loans like mortgages could come down. That would put more money in the pockets of everyday Americans and help fuel all sectors of the stock market — not to mention the benefit lower rates have on valuations. Commodities and oil prices are down, rates are coming down. That’s all good for companies and the consumer.   Energy companies as opposed to the price of oil. historically this sector has been one of the best sectors going into a rate cut. What we didn’t have in the past is a slowdown in China, that narrative should put a lid on appreciation. There may be some individual names that are exceptions. FINISH ARTICLE HERE
stars
  c526dc71 5be3 43b9 a4b3 7a907d25e102  

Daily Levels for September 23, 2024

4d2695a3 014e 4935 a3b8 4639078d935a
  Economic Reports provided by: ForexFactory.com All times are Eastern Time ( New York)
350aad2c 3117 4fe0 9ca5 a4cbd69d892c

Improve Your Trading Skills

Get access to proprietary indicators and trading methods, consult with an experienced broker at 1-800-454-9572. Explore trading methods. Register Here
3b644da2 2bee 4d39 8d98 5208a20bec39
* This is not a solicitation of any order to buy or sell, but a current market view provided by Cannon Trading Inc. Any statement of facts here in contained are derived from sources believed to be reliable, but are not guaranteed as to accuracy, nor they purport to be complete. No responsibility is assumed with respect to any such statement or with respect to any expression of opinion herein contained. Readers are urged to exercise their own judgement in trading.

Weekly Newsletter: Learn about Tick Size, Copper System, Sugar Chart + Trading Levels for Sept. 23rd

Get Real Time updates and more by joining our Private Facebook Group!
Subscribe to our YouTube Channel

C93

Cannon Futures Weekly Letter Issue # 1209

In this issue:

  • Important Notices – Heavy Fed Speaking, Active Data, Few Earnings
  • Futures 101 – Tick Size & Minimum Fluctuations
  • Hot Market of the Week – March Sugar
  • Broker’s Trading System of the Week – Copper Swing Trading System
  • Trading Levels for Next Week
  • Trading Reports for Next Week


Important Notices – Next Week Highlights:


The Week Ahead

Heavy Fed Speak Week, active data and a few earnings highlight the week ahead.


Light Earnings, by largest Market Cap

  • Wed, Micron Technologies After the close
  • Thursday, Accenture pre-open, Costco after the close


Fed Speak schedule

  • Mon. Goolsbee 9:15am CDT, Kashkari Noon CDT
  • Tues. Bowman 8:00am CDT
  • Wed. Kugler 3:00pm CDT
  • Thu. Collins 8:10amCDT, Powell 8:20am CDT, Williams 8:25 CDT, Treasury Sec. Yellen 10:15am CDT


Big Economic Data week:

  • Mon. S&P PMI Flash
  • Tues. Case-Shiller Home prices, CB Consumer Confidence, Redbook, Richmond Fed.
  • Wed. Building Permits, New Home Sales
  • Thur. Jobless Claims, Core PCE Final, GDP Final, Durable goods, Pending Home sales
  • Fri. Personal Income, Retail and Wholesale Inventories, Michigan consumer sentiment


How to Rollover on the E-Futures Platform video below

thumbnail?url=https%3A%2F%2Fi.vimeocdn


  • Futures 101: Tick Movements: Understanding How They Work

    Minimum Price Fluctuation

    All futures contracts have a minimum price fluctuation also known as a tick. Tick sizes are set by the exchange and vary by contract instrument.

    E-min S&P 500 tick

    For example, the tick size of an E-Mini S&P 500 Futures Contract is equal to one quarter of an index point. Since an index point is valued at $50 for the E-Mini S&P 500, a movement of one tick would be

    .25 x $50 = $12.50

    NYMEX WTI Crude Oil

    The tick size of the NYMEX WTI Crude Oil contract is equal to 1 cent and the WTI contract size is 1,000 barrels. Therefore, the value of a one tick move is $10.

    Summary

    Tick sizes are defined by the exchange and vary depending on the size of the financial instrument and requirements of the marketplace. Tick sizes are set to provide optimal liquidity and tight bid-ask spreads.

    The minimum price fluctuation for any CME Group contract can be found on the product specification pages.


stars

3b644da2 2bee 4d39 8d98 5208a20bec39


    • Hot Market of the Week – December Gold

    Hot market of the week is provided by QT Market Center, A Swiss army knife charting package that’s not just for Hedgers, Cooperatives and Farmers alike but also for Spread traders, Swing traders and shorter time frame application for intraday traders with a unique proprietary indicator that can be applied to your specific trading needs.

    FREE TRIAL AVAILABLE

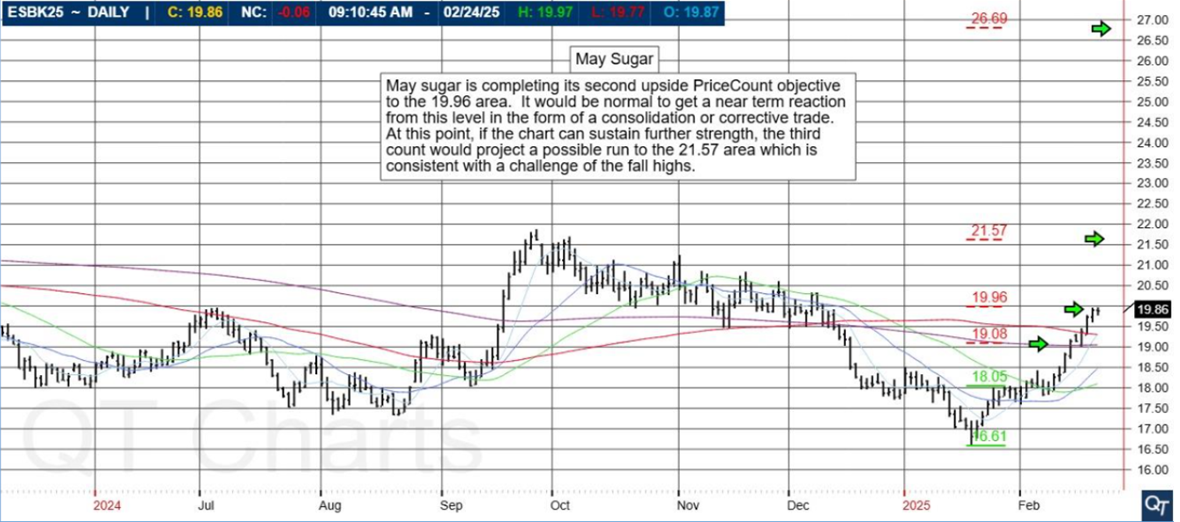
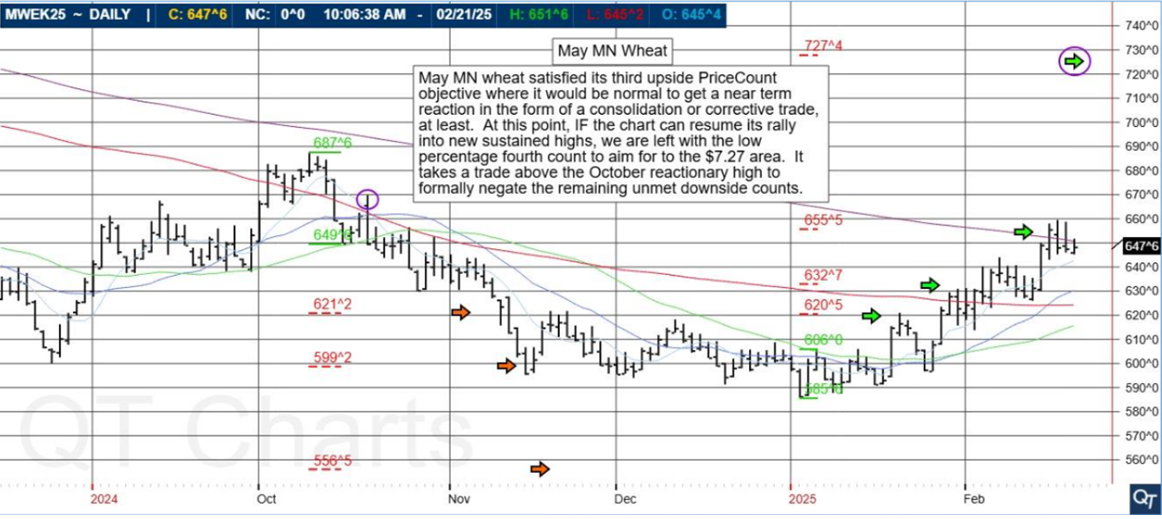
    March 2025 Sugar

    March sugar has shifted its formation back to the topisde and activated upside PriceCount objectives in the process. The chart accelerated to its first upside count to the 21.85 area. It would be normal to get a near term reaction form theis level in the form of a consolidation or corrective trdae. IF you can sustain further strength, the second count projects a possible run to the 23.26 area.


    PriceCounts – Not about where we’ve been, but where we might be going next!
1e5f6ba4 5ab1 4978 9add 01c8cc561e77
The PriceCount study is a tool that can help to project the distance of a move in price. The counts are not intended to be an ‘exact’ science but rather offer a target area for the four objectives which are based off the first leg of a move with each subsequent count having a smaller percentage of being achieved. It is normal for the chart to react by correcting or consolidating at an objective and then either resuming its move or reversing trend. Best utilized in conjunction with other technical tools, PriceCounts offer one more way to analyze charts and help to manage your positions and risk. Learn more at www.qtchartoftheday.com
Trading in futures, options, securities, derivatives or OTC products entails significant risks which must be understood prior to trading and may not be appropriate for all investors. Past performance of actual trades or strategies is not necessarily indicative of future results.

   Broker’s Trading System of the Week

With algorithmic trading systems becoming more prevalent in portfolio diversification, the following system has been selected as the broker’s choice for this month.

Balance Cont. v.22

PRODUCT

HG – Copper
SYSTEM TYPE

Day Trading


Recommended Cannon Trading Starting Capital

$25,000.00


COST

USD 150 / monthly

Get Started

Learn More

86422252 8f48 4ff8 83d2 83943ca53099

The performance shown above is hypothetical in that the chart represents returns in a model account. The model account rises or falls by the average single contract profit and loss achieved by clients trading actual money pursuant to the listed system’s trading signals on the appropriate dates (client fills), or if no actual client profit or loss available – by the hypothetical single contract profit and loss of trades generated by the system’s trading signals on that day in real time (real‐time) less slippage, or if no real time profit or loss available – by the hypothetical single contract profit and loss of trades generated by running the system logic backwards on back adjusted data. Please read full disclaimer HERE.
Would you like to receive daily support & resistance levels?
Yes
S
No
S

Daily Levels for September 23rd 2024

5f2ead23 5c67 4d34 94a9 f65f637a95b1


Trading Reports for Next Week

435212a9 6b73 4c73 a2f0 fcb1ef3233f7

bf9b3e0d 9c23 44e8 980c a8c01bfbe2cf

Trading Reports for Next Week

First Notice (FN), Last trading (LT) Days for the Week:
174942e6 4ea7 461f aa6d db529188220c

Improve Your Trading Skills

Get access to proprietary indicators and trading methods, consult with an experienced broker at 1-800-454-9572.

Explore trading methods. Register Here

* This is not a solicitation of any order to buy or sell, but a current market view provided by Cannon Trading Inc. Any statement of facts here in contained are derived from sources believed to be reliable, but are not guaranteed as to accuracy, nor they purport to be complete. No responsibility is assumed with respect to any such statement or with respect to any expression of opinion herein contained. Readers are urged to exercise their own judgement in trading.

Triple Witching Tomorrow: September Stock Index Futures Expire, Shift to December (ESZ24)

Get Real Time updates and more by joining our Private Facebook Group!

Subscribe to our YouTube Channel

Listen to our Market Recap Podcasts on Apple Podcasts


C62

TriPPPle witching tomorrow!

Stock Index September contracts (i.e., the E-mini and Micro S&P, Nasdaq, Dow Jones and Russell 2000.) expire Friday, Sept. 20th (8:30 A.M., Central Time). At that point, trading in these contracts halts. Stock index futures are CASH SETTLED contracts. If you hold any September futures contracts through 8:30 A.M., Central Time on Friday, they will be offset with the cash settlement price, as set by the exchange.

FRONT MONTH IS NOW DECEMBER , the symbol is Z24, example for mini SP is ESZ24

Plan your trade and trade your plan

stars

December Dollar Index

The December dollar broke down into a new low and came close enough to satisfy the third downside PriceCount objective. The chart is reacting with a corrective trade higher which is a normal response. IF you can resume the break with new sustained lows from here, we are left with the low percentage fourth count to aim for in the 97.00 area.

image 1

The PriceCount study is a tool that can help to project the distance of a move in price. The counts are not intended to be an ‘exact’ science but rather offer a target area for the four objectives which are based off the first leg of a move with each subsequent count having a smaller percentage of being achieved. It is normal for the chart to react by correcting or consolidating at an objective and then either resuming its move or reversing trend. Best utilized in conjunction with other technical tools, PriceCounts offer one more way to analyze charts and help to manage your positions and risk. Learn more at www.qtchartoftheday.com

Trading in futures, options, securities, derivatives or OTC products entails significant risks which must be understood prior to trading and may not be appropriate for all investors. Past performance of actual trades or strategies is not necessarily indicative of future results. 

Daily Levels for September 20, 2024

image

Economic Reports

provided by: ForexFactory.com

All times are Eastern Time ( New York)

image 2

Improve Your Trading Skills

Get access to proprietary indicators and trading methods, consult with an experienced broker at 1-800-454-9572.

Explore trading methods. Register Here

3b644da2 2bee 4d39 8d98 5208a20bec39

* This is not a solicitation of any order to buy or sell, but a current market view provided by Cannon Trading Inc. Any statement of facts here in contained are derived from sources believed to be reliable, but are not guaranteed as to accuracy, nor they purport to be complete. No responsibility is assumed with respect to any such statement or with respect to any expression of opinion herein contained. Readers are urged to exercise their own judgement in trading.

4 Years in the Making: Will the Fed Cut Rates by 0.25 or 0.50 Tomorrow?

Get Real Time updates and more by joining our Private Facebook Group!
Subscribe to our YouTube Channel
Listen to our Market Recap Podcasts on Apple Podcasts


C95


4 Years in the Making

By John Thorpe, Senior Broker


How Much will the FOMC Cut rates tomorrow? .25 or .50 basis points from 5.25/5.5 % ?

As of the issuance of this Blog Post. The September Fed Funds futures contract is reflecting a 63% probability of a .50 basis point cut and 37% probability of a .25 basis cut.

It is my view, not Cannon Trading company’s ,that a .25 basis rate cut would disappoint the Equity index markets as the recent rally had caught steam at every turn when the possibility of .50 rate cut was mentioned by FOMC governors during public speeches and the most recent economic data revealing a softening of economic data and loosening of a previously tight labor market . ( You may recall on August 21st the Bureau of Labor Statistics released a report that jobs growth had been overstated by more than 800,000 souls between 3/23 and 3/24?) Where was the ES trading at the close of business on that day? 5641.50 , we are still in that wheelhouse. A .50 basis point cut may continue the current rally. 1:00 pm EDT , the first rate cut in 4 years will be here, are you ready?


Tomorrow: in addition to Rates and Powell Presser; you will also get FOMC Summary of Economic Projections (released only 4 times a year during rate announcements)

Here is a sample of the summary of Economic events from the June ’24 rate decision meeting, not to be confused with the FOMC Minutes.  https://Https://www.federalreserve.gov/monetarypolicy/files/fomcprojtabl20240612.pdf


stars


Daily Levels for September 18, 2024

d89ee7b4 38fa 456c afb0 daa47a7b7d3f


Economic Reports
provided by: ForexFactory.com
All times are Eastern Time ( New York)
21d8ec2e e28c 43a2 8db6 661aaec14606

Improve Your Trading Skills

Get access to proprietary indicators and trading methods, consult with an experienced broker at 1-800-454-9572.

Explore trading methods. Register Here

3b644da2 2bee 4d39 8d98 5208a20bec39

* This is not a solicitation of any order to buy or sell, but a current market view provided by Cannon Trading Inc. Any statement of facts here in contained are derived from sources believed to be reliable, but are not guaranteed as to accuracy, nor they purport to be complete. No responsibility is assumed with respect to any such statement or with respect to any expression of opinion herein contained. Readers are urged to exercise their own judgement in trading.

Prepare for a Disciplined Week: FOMC, Contract Rollover, and More – Stay Focused!

Get Real Time updates and more by joining our Private Facebook Group!
Subscribe to our YouTube Channel
Listen to our Market Recap Podcasts on Apple Podcasts


C70


Busy week ahead! FOMC, contract rollover and more. Make it a solid, disciplined trading week!

Friday, Sept. 20th is Last Trading Day for September stock index futures contracts, i.e., the E-mini S&P, E-mini NASDAQ, E-mini Dow Jones and their Micro relatives. These futures contracts will halt trading at 8:30 A.M., Central Time and are cash settled, meaning any remaining open positions will be offset/settled using a to-be-determined settlement price. It is recommended that all new positions be placed in the December ’24 contracts.

Volume in the September ‘24 contracts will begin to drop off until their expiration next Friday, September 20.

Trading levels on our blog will switch to the December contract tomorrow!

See below a screen shot of volume and open interest on the Mini SP contract for example:

d3f5718a 2ddc 43a2 a821 d1ea61d208a1


stars


059b231c 189d 4c3f 9964 ac98a1f114f0


How to roll over Chart and DOM on E-Futures


thumbnail?url=https%3A%2F%2Fi.vimeocdn

Daily Levels for September 17, 2024

0aa02d5e a8a5 41cf 8220 0ea12526c150


Economic Reports
provided by: ForexFactory.com
All times are Eastern Time ( New York)
df95071f afdb 428d 9deb 3604425ff864

Improve Your Trading Skills

Get access to proprietary indicators and trading methods, consult with an experienced broker at 1-800-454-9572.

Explore trading methods. Register Here

3b644da2 2bee 4d39 8d98 5208a20bec39

* This is not a solicitation of any order to buy or sell, but a current market view provided by Cannon Trading Inc. Any statement of facts here in contained are derived from sources believed to be reliable, but are not guaranteed as to accuracy, nor they purport to be complete. No responsibility is assumed with respect to any such statement or with respect to any expression of opinion herein contained. Readers are urged to exercise their own judgement in trading.

Weekly Newsletter: Learn About Rollover, Gold Chart + Trading Levels for Sept. 16th

Get Real Time updates and more by joining our Private Facebook Group!
Subscribe to our YouTube Channel

C3

Cannon Futures Weekly Letter Issue # 1208

In this issue:

  • Important Notices – Rollover and FOMC
  • Futures 101 – Learn About Contract Expiration, Rollover, Offset Options
  • Hot Market of the Week – December Gold
  • Broker’s Trading System of the Week – NQ Day Trading System
  • Trading Levels for Next Week
  • Trading Reports for Next Week


Important Notices – Next Week Highlights:


Fed Rate Decision, Index Contract rollover, within a somewhat active Data week.

Light Earnings (185 companies) Week:

  • Gen Mills, Fedex and Lennar, headline


Fed Rate Decision Wednesday. 1:00PM Central with Q and A to follow @ 1:30 PM central.


Somewhat Active Data week:

  • Mon. NY Empire State Index,
  • Tues. Retail Sales, RedBook, Industrial Production
  • Wed. Bldg Permits, Housing Starts, Fed Rate Decision, FOMC Economic Projections
  • Thu. Jobless Claims, Philly Fed Manufacturing, Existing Home Sales
  • Fri. No news is good news?

Currencies Last Trading Day & Stock Index rollover

Monday, September 16th is Last Trading Day for all currency futures contracts, except the Canadian Dollar (Last Trading Day for the Canadian Dollar is Tuesday, September 14th). Currency futures contracts are DELIVERABLE contracts. You need to exit all long and short open positions or be required to deliver or take delivery of the ACTUAL NOMINAL VALUE of the respective futures contract, i.e. $12,500 Euros, or $12,500,000 Japanese Yen. DO NOT put your account is this position. Exit all September currency futures. Start trading currency futures with the December futures contracts.


Friday, Sept. 20th is Last Trading Day for September stock index futures contracts, i.e., the E-mini S&P, E-mini NASDAQ, E-mini Dow Jones and their Micro relatives. These futures contracts will halt trading at 8:30 A.M., Central Time and are cash settled, meaning any remaining open positions will be offset/settled using a to-be-determined settlement price. It is recommended that all new positions be placed in the December ’24 contracts as of Sunday’s opening. Volume in the September ‘24 contracts will begin to drop off until their expiration next Friday, September 20.


How to Rollover on the E-Futures Platform video below

thumbnail?url=https%3A%2F%2Fi.vimeocdn


  • Futures 101: Understanding Futures Expiration & Contract Roll

    • Contract Expiration Options
    • Lifespan of future contracts
    • Rollover

    ACCESS THE COURSE NOW


stars

3b644da2 2bee 4d39 8d98 5208a20bec39


    • Hot Market of the Week – December Gold

    Hot market of the week is provided by QT Market Center, A Swiss army knife charting package that’s not just for Hedgers, Cooperatives and Farmers alike but also for Spread traders, Swing traders and shorter time frame application for intraday traders with a unique proprietary indicator that can be applied to your specific trading needs.

    FREE TRIAL AVAILABLE

    December Gold


    December gold has resumed its rally into new highs. This has the chart aim at its third upside PriceCount objective to the 2620 area. It would be normal to get a near term reaction int the form of a consolidation or corrective trade, at least, upon satisfying the count. The low percentage fourth target to 3325 is not shown here for presentation purposes.


    PriceCounts – Not about where we’ve been, but where we might be going next!

cf4501c2 c737 4f27 a322 2a1638672e29
The PriceCount study is a tool that can help to project the distance of a move in price. The counts are not intended to be an ‘exact’ science but rather offer a target area for the four objectives which are based off the first leg of a move with each subsequent count having a smaller percentage of being achieved. It is normal for the chart to react by correcting or consolidating at an objective and then either resuming its move or reversing trend. Best utilized in conjunction with other technical tools, PriceCounts offer one more way to analyze charts and help to manage your positions and risk. Learn more at www.qtchartoftheday.com
Trading in futures, options, securities, derivatives or OTC products entails significant risks which must be understood prior to trading and may not be appropriate for all investors. Past performance of actual trades or strategies is not necessarily indicative of future results.

   Broker’s Trading System of the Week

With algorithmic trading systems becoming more prevalent in portfolio diversification, the following system has been selected as the broker’s choice for this month.

Fusion NQ

PRODUCT

NQ – Mini NASDAQ


SYSTEM TYPE

Day Trading


Recommended Cannon Trading Starting Capital

$36,000.00


COST

USD 150 / monthly

Get Started

Learn More

486140b4 5560 4afe a015 07a529272bef

The performance shown above is hypothetical in that the chart represents returns in a model account. The model account rises or falls by the average single contract profit and loss achieved by clients trading actual money pursuant to the listed system’s trading signals on the appropriate dates (client fills), or if no actual client profit or loss available – by the hypothetical single contract profit and loss of trades generated by the system’s trading signals on that day in real time (real‐time) less slippage, or if no real time profit or loss available – by the hypothetical single contract profit and loss of trades generated by running the system logic backwards on back adjusted data. Please read full disclaimer HERE.
Would you like to receive daily support & resistance levels?
Yes
S
No
S

Daily Levels for September 16th 2024

fe7b0bf7 db24 4464 8b35 f727a4292f7e


Trading Reports for Next Week

3005a3dc f2f9 40cb beb4 a6e54bacbe94

bf9b3e0d 9c23 44e8 980c a8c01bfbe2cf

Trading Reports for Next Week

First Notice (FN), Last trading (LT) Days for the Week:
e5322dea e362 4015 a40b 3e9bf2281d92

Improve Your Trading Skills

Get access to proprietary indicators and trading methods, consult with an experienced broker at 1-800-454-9572.

Explore trading methods. Register Here

* This is not a solicitation of any order to buy or sell, but a current market view provided by Cannon Trading Inc. Any statement of facts here in contained are derived from sources believed to be reliable, but are not guaranteed as to accuracy, nor they purport to be complete. No responsibility is assumed with respect to any such statement or with respect to any expression of opinion herein contained. Readers are urged to exercise their own judgement in trading.

Unlocking Bitcoin’s Potential: Trading Futures for Profit Without Holding Bitcoin

Get Real Time updates and more by joining our Private Facebook Group!
Subscribe to our YouTube Channel
Listen to our Market Recap Podcasts on Apple Podcasts


Bitcoin


Bitcoin Futures

By Mark O’Brien, Senior Broker


Typically, if you’re interested in Bitcoin, it’s for two reasons:


One is that you want to convert your dollars to Bitcoin so that you can buy products and services with it, because there’s no administrator involved in the transaction like a bank or credit card company, or a PayPal or Zelle-type of entity.  That’s why it’s called a decentralized currency: only the two sides of the transaction can see it.


But unlike a currency-backed transaction – like U.S. dollar transactions – Bitcoin transactions don’t come with legal protection and they’re typically not reversible, which makes them susceptible to scams.  And if or when you convert your Bitcoin back to U.S. dollars, you have to report capital gains and losses.


The fact is cash – and in particular the U.S. dollar – is still king.  In the entire world, the dollar is currently involved in almost 60% of all transactions – in commerce, business and in trading.  That’s compared to the next most used currency, the Euro at ±13%.  In third place is the Japanese yen at ±5%.  All the other currencies in the world, including such notables as the Swiss Franc, British pound, Chinese yuan and to a miniscule degree Bitcoin – they’re all little tiny slivers to the financial transaction pie.  That’s why people invest with U.S. dollars.


This brings me to the other reason people are interested in Bitcoin: it’s an asset that moves up and down in price and that movement can be an opportunity to increase the value of your Bitcoin you hold.  The unfortunate shortcoming for Bitcoin investors however, is that you’re limited only to profiting from buying Bitcoin low and selling high – and converting your Bitcoin back to dollars to realize any profit.


There’s a much better alternative to invest in Bitcoin.  For people looking to profit from Bitcoin price movement: consider trading the price movement you see in Bitcoin every day, yet never have to actually be in Bitcoin, but rather a derivative of it.  Trade an asset that moves in sync with Bitcoin, is valued and traded in U.S. dollars and is listed on the largest financial derivatives exchange in the world.


The exchange I’m talking about is the CME Group, and the asset – there are actually three assets: the Bitcoin futures contract, the Micro Bitcoin futures contract and the newest Bitcoin Friday futures contract (sized at 1/50 of a Bitcoin like the Micro Bitcoin and cash-settled every Friday).


These three assets trade on the CME where all participants see the same prices and quotes and you enjoy the price discovery of a transparent futures contract.  Of course, as a futures contract you can trade on the long and short side of the market.


If you’re a trader – in stocks, mutual funds, real estate, or other commodity futures such as stock indexes, precious metals, energies, grains, etc. and you’re looking to diversify your assets into digital currency and Bitcoin specifically, look into Bitcoin futures and trade with assurance in the asset.

Trade Micro Bitcoin with real-time price and DEMO money INSTANTLY


stars


Daily Levels for September 13, 2024

6cf7e978 b701 4e04 9259 b2e519612327

d2f804c7 f7ea 40e2 9b38 5681293c1d7f


December Gold

December gold has resumed its rally into new highs. This has the chart aim at its third upside PriceCount objective to the 2620 area. It would be normal to get a near term reaction int the form of a consolidation or corrective trade, at least, upon satisfying the count. The low percentage fourth target to 3325 is not shown here for presentation purposes.

The PriceCount study is a tool that can help to project the distance of a move in price. The counts are not intended to be an ‘exact’ science but rather offer a target area for the four objectives which are based off the first leg of a move with each subsequent count having a smaller percentage of being achieved. It is normal for the chart to react by correcting or consolidating at an objective and then either resuming its move or reversing trend. Best utilized in conjunction with other technical tools, PriceCounts offer one more way to analyze charts and help to manage your positions and risk. Learn more at www.qtchartoftheday.com


Trading in futures, options, securities, derivatives or OTC products entails significant risks which must be understood prior to trading and may not be appropriate for all investors. Past performance of actual trades or strategies is not necessarily indicative of future results.


Economic Reports
provided by: ForexFactory.com
All times are Eastern Time ( New York)
eec19d1c d9dd 4580 90df 6b97ecac0720

Improve Your Trading Skills

Get access to proprietary indicators and trading methods, consult with an experienced broker at 1-800-454-9572.

Explore trading methods. Register Here

3b644da2 2bee 4d39 8d98 5208a20bec39

* This is not a solicitation of any order to buy or sell, but a current market view provided by Cannon Trading Inc. Any statement of facts here in contained are derived from sources believed to be reliable, but are not guaranteed as to accuracy, nor they purport to be complete. No responsibility is assumed with respect to any such statement or with respect to any expression of opinion herein contained. Readers are urged to exercise their own judgement in trading.

Post-CPI Market Reversal: Stock Indices Lead the Charge, Eyes on Jobless Claims and PPI Tomorrow

Get Real Time updates and more by joining our Private Facebook Group!
Subscribe to our YouTube Channel
Listen to our Market Recap Podcasts on Apple Podcasts


C35


Interesting action to say the least following CPI this morning.

Indices, energies and metals sold off and then made a V type reversal, mostly with stock indices, NASDAQ and SP leading the way – ES and NQ.

See a 30 minute chart from today below.

As far as tomorrow:

US weekly jobless claims will be released at 7:30 am CT Thursday morning, initial claims are expected at 225,000, down -2,000 from the prior week.


US August producer price indices (PPI) will be released Thursday morning at 7:30 am CT, analysts expect final demand PPI +0.2% month over month, and expect the core PPI up +0.2% compared to the previous month.

ECB Press conference at 7:45 AM Central time.

Natural gas inventories at 9:30 Am central


stars


Daily Levels for September 12, 2024

6cf03336 57ef 4777 a5b8 bc2c418b295c


Economic Reports
provided by: ForexFactory.com
All times are Eastern Time ( New York)
d8c7300d 8cae 4a1f b883 a486c4f2bbb9

Improve Your Trading Skills

Get access to proprietary indicators and trading methods, consult with an experienced broker at 1-800-454-9572.

Explore trading methods. Register Here

3b644da2 2bee 4d39 8d98 5208a20bec39

* This is not a solicitation of any order to buy or sell, but a current market view provided by Cannon Trading Inc. Any statement of facts here in contained are derived from sources believed to be reliable, but are not guaranteed as to accuracy, nor they purport to be complete. No responsibility is assumed with respect to any such statement or with respect to any expression of opinion herein contained. Readers are urged to exercise their own judgement in trading.