Cannon Futures Weekly Letter Issue # 1073
Dear Traders,
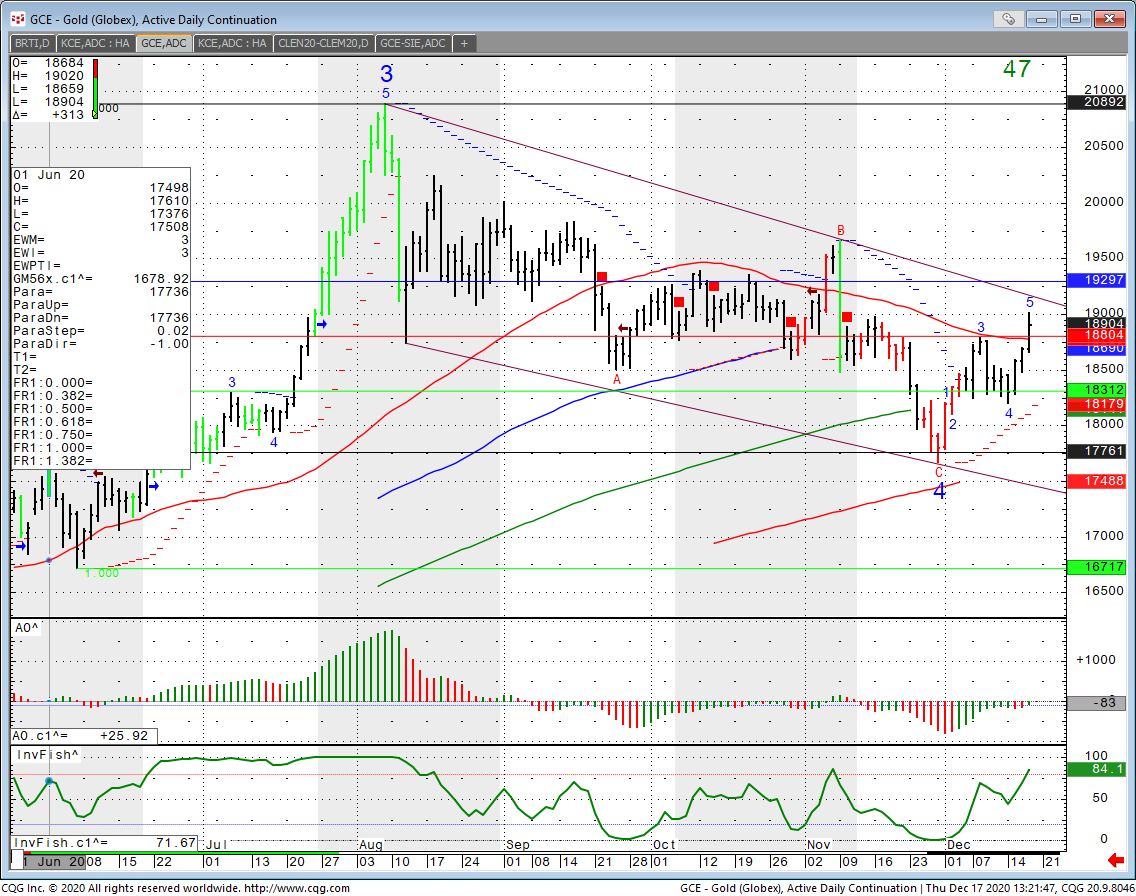
Day Trading 201: Using Tick/Volume charts and Oscillators for Scalping
- It uses a tick chart rather than a time chart. I like tick charts ( range bar, volume charts, renko) better when day-trading shorter time frames for the simple reason it already includes a big factor in the market, VOLUME. If you are using a 5 minute chart for example, you may get signals simply because time “has passed” and certain indicators you are using adopt certain values. When using tick charts during periods where there are lots of movement, you won’t have to wait until your time frame bar closes to get your signal, volume becomes a bigger more important part of your trading decision.
- The other part for this trading approach is to use overbought/ oversold indicators in an attempt to catch exhuastion in selling or buying and catch the counter trend move. Sometimes that move will be minor, sometimes it will be a trend reversal and at other times just a little pause in a strong trend….no crystal balls here, just another tool to observe and consider in your trading. In the PDF you will see the same indicators, same market, same time frame BUT using different type of charts…..
Good Trading
Trading Futures, Options on Futures, and retail off-exchange foreign currency transactions involves substantial risk of loss and is not suitable for all investors. You should carefully consider whether trading is suitable for you in light of your circumstances, knowledge, and financial resources. You may lose all or more of your initial investment. Opinions, market data, and recommendations are subject to change at any time when it comes to Futures Trading.
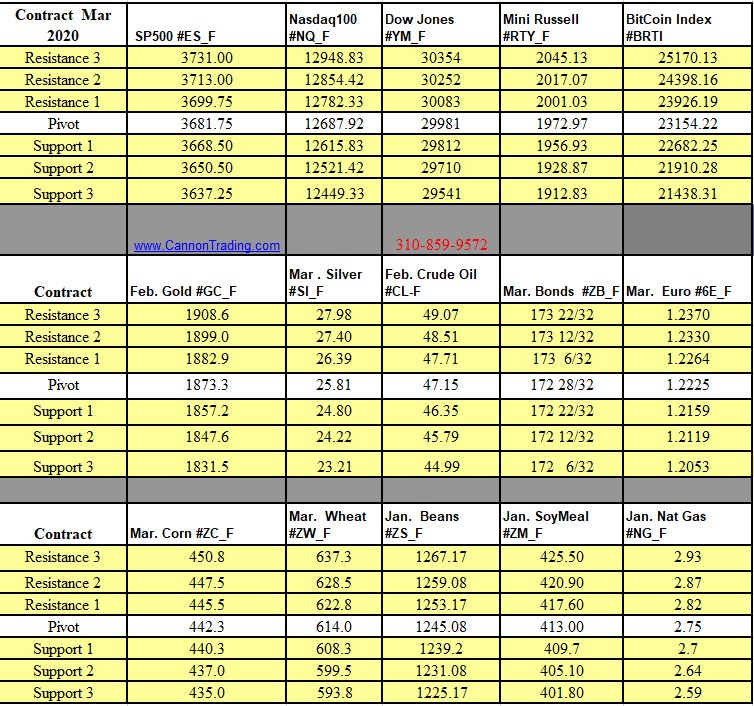
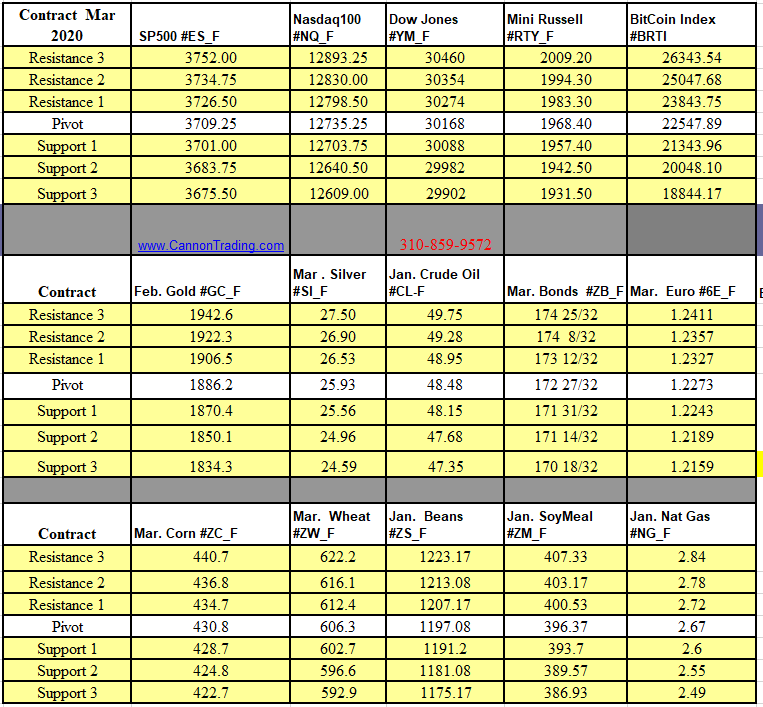
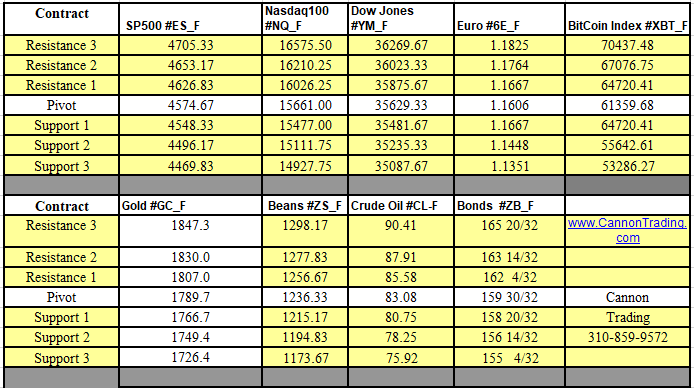
Futures Trading Levels
11-01.2021
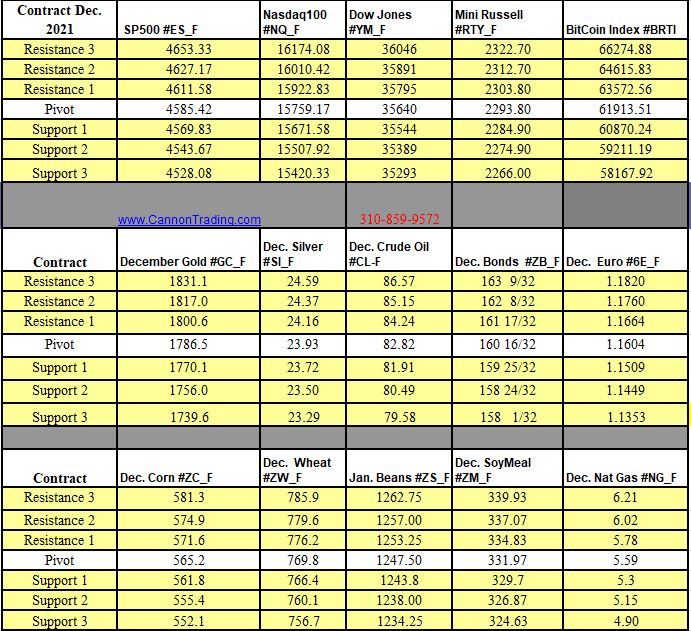
Weekly Levels
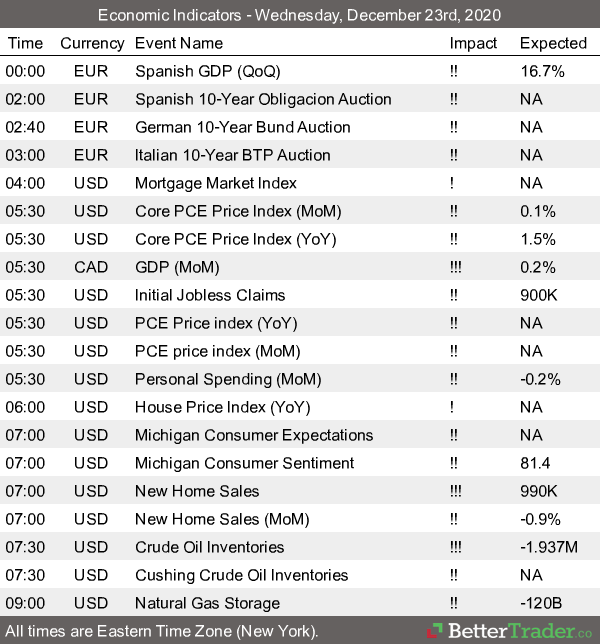
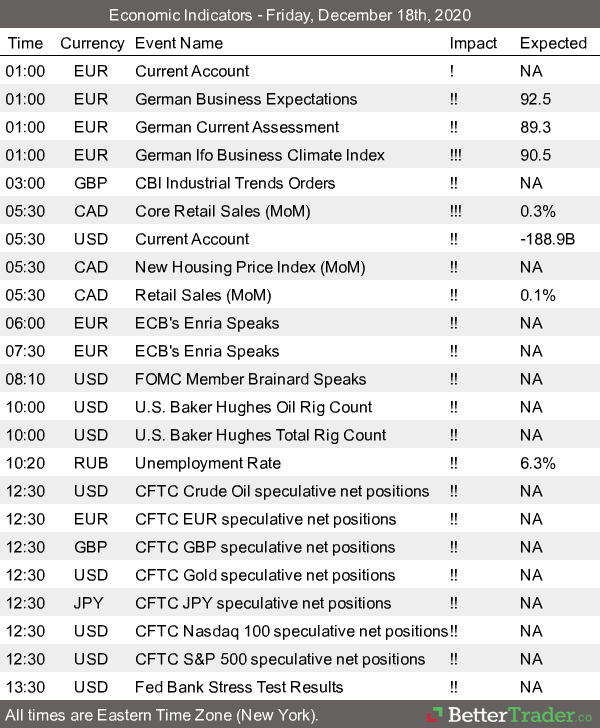
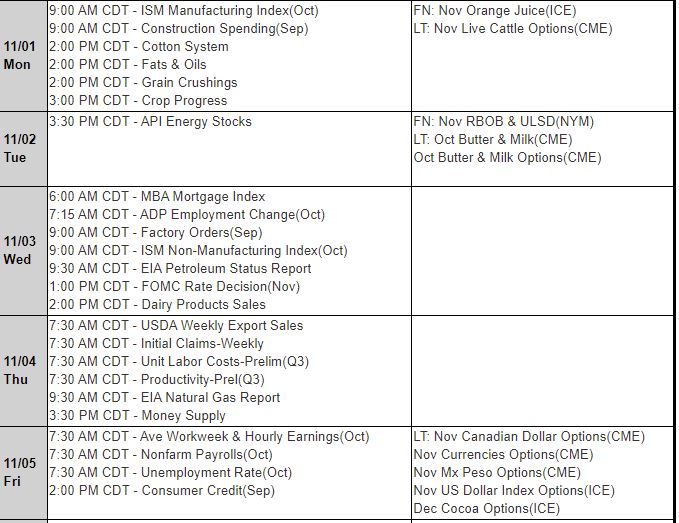
Reports, First Notice (FN), Last trading (LT) Days for the Week:
This is not a solicitation of any order to buy or sell, but a current market view provided by Cannon Trading Inc. Any statement of facts here in contained are derived from sources believed to be reliable, but are not guaranteed as to accuracy, nor they purport to be complete. No responsibility is assumed with respect to any such statement or with respect to any expression of opinion herein contained. Readers are urged to exercise their own judgement in trading